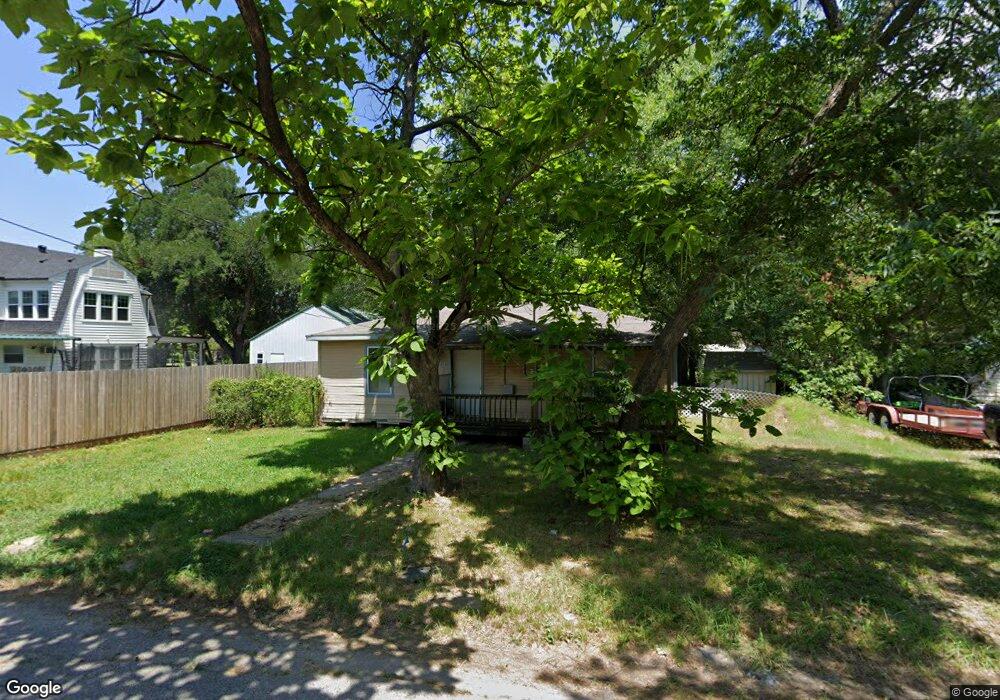
804 Pine St Bonham, TX 75418
Estimated Value: $114,636 - $142,000
Studio
--
Bath
828
Sq Ft
$154/Sq Ft
Est. Value
About This Home
This home is located at 804 Pine St, Bonham, TX 75418 and is currently estimated at $127,409, approximately $153 per square foot. 804 Pine St is a home located in Fannin County with nearby schools including Evans Elementary School, Finley-Oates Elementary School, and LH Rather Jr High School.
Ownership History
Date
Name
Owned For
Owner Type
Purchase Details
Closed on
Apr 25, 2023
Sold by
Whitfield Sally A
Bought by
Essary Davy and Essary Contessa
Current Estimated Value
Purchase Details
Closed on
Oct 26, 2007
Sold by
Wright Fred R and Wright Micheline S
Bought by
Whitfield Sally A
Home Financials for this Owner
Home Financials are based on the most recent Mortgage that was taken out on this home.
Original Mortgage
$7,000
Interest Rate
6.32%
Mortgage Type
Purchase Money Mortgage
Create a Home Valuation Report for This Property
The Home Valuation Report is an in-depth analysis detailing your home's value as well as a comparison with similar homes in the area
Purchase History
We collect this data history from publicly available records. To have your information removed, we recommend requesting removal directly through your county’s website.
| Date | Buyer | Sale Price | Title Company |
|---|---|---|---|
| Essary Davy | -- | Cole Title | |
| Whitfield Sally A | -- | None Available |
Source: Public Records
Mortgage History
We collect this data history from publicly available records. To have your information removed, we recommend requesting removal directly through your county’s website.
| Date | Status | Borrower | Loan Amount |
|---|---|---|---|
| Previous Owner | Whitfield Sally A | $7,000 |
Source: Public Records
Tax History
| Year | Tax Paid | Tax Assessment Tax Assessment Total Assessment is a certain percentage of the fair market value that is determined by local assessors to be the total taxable value of land and additions on the property. | Land | Improvement |
|---|---|---|---|---|
| 2025 | $1,117 | $98,038 | $35,470 | $62,568 |
| 2024 | $931 | $48,010 | $35,300 | $12,710 |
| 2023 | $1,015 | $51,450 | $22,440 | $29,010 |
| 2022 | $972 | $44,200 | $16,550 | $27,650 |
| 2021 | $831 | $32,880 | $8,590 | $24,290 |
| 2020 | $734 | $28,730 | $6,000 | $22,730 |
| 2019 | $730 | $27,460 | $5,880 | $21,580 |
| 2018 | $490 | $26,470 | $5,830 | $20,640 |
| 2017 | $429 | $21,080 | $3,060 | $18,020 |
| 2016 | $390 | $19,280 | $3,060 | $16,220 |
| 2015 | -- | $13,880 | $2,940 | $10,940 |
| 2014 | -- | $14,190 | $2,400 | $11,790 |
Source: Public Records
Map
Nearby Homes
Your Personal Tour Guide
Ask me questions while you tour the home.