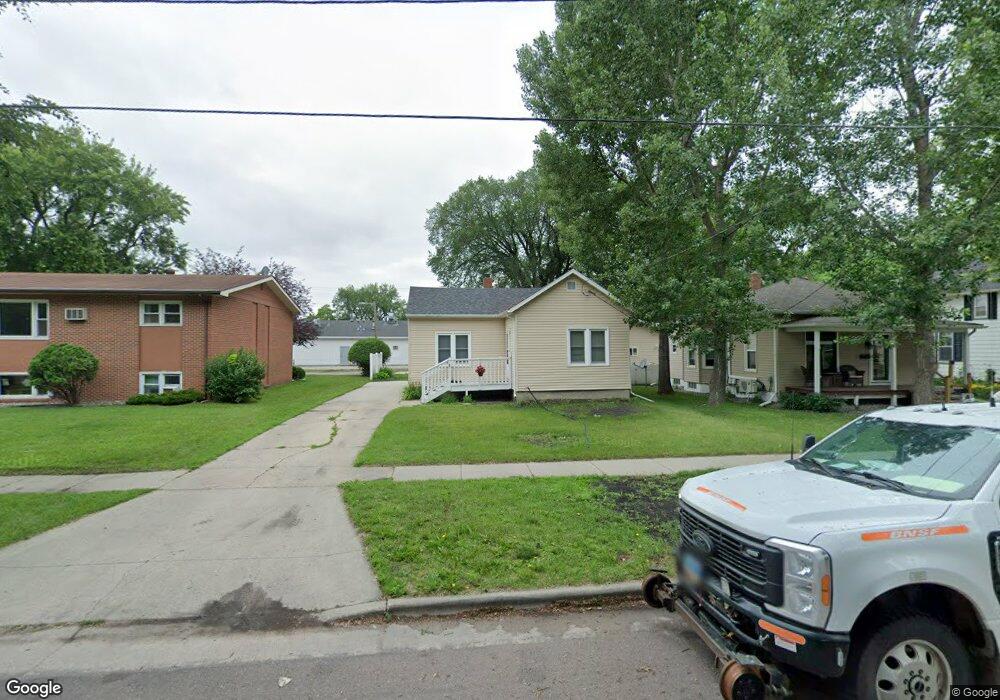
806 12th St N Fargo, ND 58102
Roosevelt NeighborhoodEstimated Value: $163,000 - $180,000
2
Beds
2
Baths
928
Sq Ft
$185/Sq Ft
Est. Value
About This Home
This home is located at 806 12th St N, Fargo, ND 58102 and is currently estimated at $171,374, approximately $184 per square foot. 806 12th St N is a home located in Cass County with nearby schools including Horace Mann Roosevelt Elementary School, Ben Franklin Middle School, and North High School.
Ownership History
Date
Name
Owned For
Owner Type
Purchase Details
Closed on
May 14, 2024
Sold by
Ernest Shelly R and Ernest Byron Shelly
Bought by
Brundin Alexandria
Current Estimated Value
Home Financials for this Owner
Home Financials are based on the most recent Mortgage that was taken out on this home.
Original Mortgage
$161,500
Outstanding Balance
$159,209
Interest Rate
6.82%
Mortgage Type
New Conventional
Estimated Equity
$12,165
Create a Home Valuation Report for This Property
The Home Valuation Report is an in-depth analysis detailing your home's value as well as a comparison with similar homes in the area
Home Values in the Area
Average Home Value in this Area
Purchase History
| Date | Buyer | Sale Price | Title Company |
|---|---|---|---|
| Brundin Alexandria | $170,000 | None Listed On Document |
Source: Public Records
Mortgage History
| Date | Status | Borrower | Loan Amount |
|---|---|---|---|
| Open | Brundin Alexandria | $161,500 |
Source: Public Records
Tax History
| Year | Tax Paid | Tax Assessment Tax Assessment Total Assessment is a certain percentage of the fair market value that is determined by local assessors to be the total taxable value of land and additions on the property. | Land | Improvement |
|---|---|---|---|---|
| 2024 | $2,082 | $81,750 | $14,750 | $67,000 |
| 2023 | $2,506 | $79,350 | $14,750 | $64,600 |
| 2022 | $2,166 | $69,600 | $14,750 | $54,850 |
| 2021 | $2,091 | $69,600 | $14,750 | $54,850 |
| 2020 | $2,067 | $69,600 | $14,750 | $54,850 |
| 2019 | $1,988 | $66,550 | $6,850 | $59,700 |
| 2018 | $1,965 | $66,550 | $6,850 | $59,700 |
| 2017 | $1,705 | $63,400 | $6,850 | $56,550 |
| 2016 | $1,501 | $61,550 | $6,850 | $54,700 |
| 2015 | $1,293 | $49,450 | $5,800 | $43,650 |
| 2014 | $1,264 | $47,100 | $5,800 | $41,300 |
| 2013 | $1,196 | $44,850 | $5,800 | $39,050 |
Source: Public Records
Map
Nearby Homes
- 904 12th St N
- 1001 9th Ave N
- 735 14th St N
- 729 14th St N
- 1036 12th St N
- 1035 University Dr N
- 824 9th St N
- 1036 College St N
- 1025 14th St N
- 1038 College St N
- 1105 11th St N
- 1045 10th St N
- 813 6th Ave N Unit C16
- 809 6th Ave N Unit C14
- 722 9th Ave N
- 1109 10th St N
- 1122 4th Ave N
- 809 11th Ave N
- 711 7th Ave N
- 1119 9th St N
Your Personal Tour Guide
Ask me questions while you tour the home.