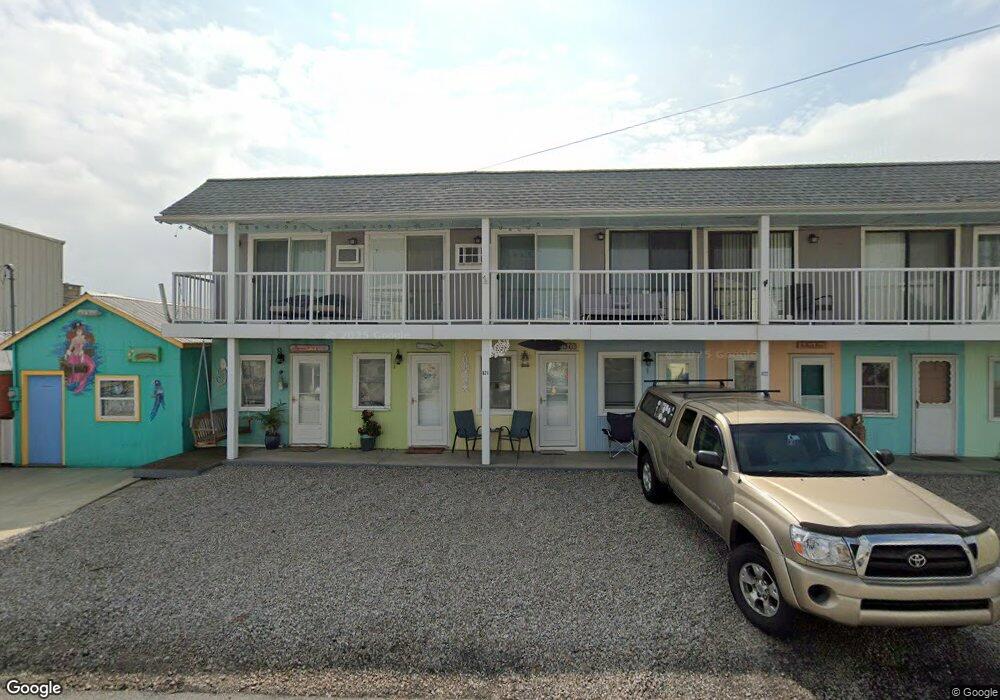
808 Curran St Sandusky, OH 44870
Estimated Value: $449,000 - $716,000
2
Beds
2
Baths
2,832
Sq Ft
$213/Sq Ft
Est. Value
About This Home
This home is located at 808 Curran St, Sandusky, OH 44870 and is currently estimated at $602,048, approximately $212 per square foot. 808 Curran St is a home located in Erie County with nearby schools including Sandusky High School, Monroe Preparatory Academy, and Sandusky Central Catholic School.
Ownership History
Date
Name
Owned For
Owner Type
Purchase Details
Closed on
Jan 21, 2022
Sold by
Hoelzer Daniel J and Hoelzer Jackie S
Bought by
Roman Marc and Romano Rhonda
Current Estimated Value
Purchase Details
Closed on
Dec 16, 2013
Sold by
Hoelzer Daniel J and Hoelzer Jackie S
Bought by
H T Properties Inc
Purchase Details
Closed on
Dec 14, 2013
Sold by
H T Properties Inc
Bought by
Hoelzer Daniel J and Hoelzer Jackie S
Create a Home Valuation Report for This Property
The Home Valuation Report is an in-depth analysis detailing your home's value as well as a comparison with similar homes in the area
Home Values in the Area
Average Home Value in this Area
Purchase History
| Date | Buyer | Sale Price | Title Company |
|---|---|---|---|
| Roman Marc | $378,750 | Reminder Co Lpa | |
| H T Properties Inc | -- | None Available | |
| Hoelzer Daniel J | -- | None Available | |
| Hoelzer Daniel J | -- | None Available |
Source: Public Records
Tax History
| Year | Tax Paid | Tax Assessment Tax Assessment Total Assessment is a certain percentage of the fair market value that is determined by local assessors to be the total taxable value of land and additions on the property. | Land | Improvement |
|---|---|---|---|---|
| 2025 | $6,139 | $164,342 | $21,637 | $142,705 |
| 2024 | $6,139 | $164,342 | $21,637 | $142,705 |
| 2023 | $6,336 | $164,514 | $13,524 | $150,990 |
| 2022 | $8,339 | $164,510 | $13,524 | $150,986 |
| 2021 | $4,716 | $92,180 | $13,520 | $78,660 |
| 2020 | $4,289 | $77,060 | $13,520 | $63,540 |
| 2019 | $4,410 | $77,060 | $13,520 | $63,540 |
| 2018 | $4,415 | $77,060 | $13,520 | $63,540 |
| 2017 | $3,802 | $66,150 | $8,520 | $57,630 |
| 2016 | $3,800 | $66,150 | $8,520 | $57,630 |
| 2015 | $3,442 | $66,150 | $8,520 | $57,630 |
| 2014 | $3,422 | $66,150 | $8,520 | $57,630 |
| 2013 | $3,255 | $63,560 | $5,930 | $57,630 |
Source: Public Records
Map
Nearby Homes
- 808 Curran St
- 808 Curran St Unit D
- 808 Curran #112 & 113
- 0 Cove
- 824 Curran St
- 822 Curran St
- 824 Curran St
- 826 Curran St
- 828 Curran St
- 808 Cove
- 830 Curran St
- 832 Curran St
- 818 Curran St
- 818 Curran St
- 818 Curran St
- 820 Curran St Unit 5
- 834 Curran St
- 419 Anderson Annex Lots
- 410 Cove St
- 404 Cove St Ns Unit 1&2
Your Personal Tour Guide
Ask me questions while you tour the home.