d
Seller's Agent in 2021
datacorrect BrightMLS
Non Subscribing Office

Estimated Value: $1,091,000 - $1,183,000
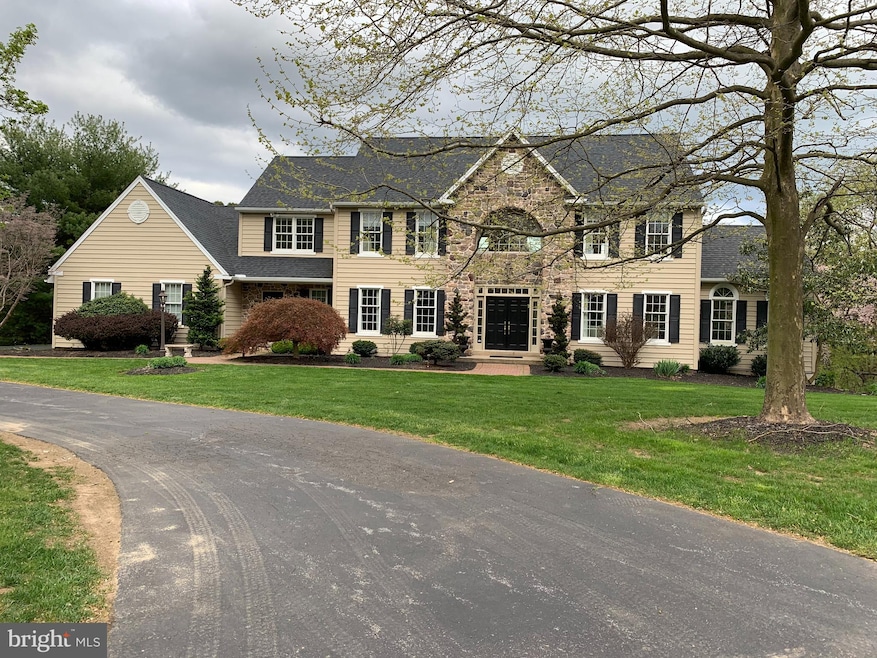
This home is located at 808 Roberts Way, Kennett Square, PA 19348 since 23 April 2021 and is currently estimated at $1,126,189, approximately $223 per square foot. This property was built in 1994. 808 Roberts Way is a home located in Chester County with nearby schools including Pocopson Elementary School, Charles F. Patton Middle School, and Unionville High School.
Last Agent to Sell the Property
(844) 552-7444 datacorrect@brightmls.com Non Subscribing Office License #0225194075 Listed on: 04/23/2021
Last Buyer's Agent
(610) 675-7100 frontdeskremax1479@gmail.com RE/MAX Town & Country License #RS-039232

We collect this data history from publicly available records. To have your information removed, we recommend requesting removal directly through your county’s website.
We collect this data history from publicly available records. To have your information removed, we recommend requesting removal directly through your county’s website.
| Date | Buyer | Sale Price | Title Company |
|---|---|---|---|
| $812,000 | None Available | ||
| $700,000 | None Available | ||
| $450,000 | -- |
We collect this data history from publicly available records. To have your information removed, we recommend requesting removal directly through your county’s website.
| Date | Status | Borrower | Loan Amount |
|---|---|---|---|
| Open | $649,600 | ||
| Previous Owner | $700,000 | ||
| Previous Owner | $350,000 |
We collect this data history from publicly available records. To have your information removed, we recommend requesting removal directly through your county’s website.
| Date | Event | Price | List to Sale | Price per Sq Ft | Prior Sale |
|---|---|---|---|---|---|
| 04/23/2021 04/23/21 | For Sale | $812,000 | 0.0% | $161 / Sq Ft | |
| 04/22/2021 04/22/21 | Sold | $812,000 | +16.0% | $161 / Sq Ft | |
| 03/22/2021 03/22/21 | Pending | -- | -- | -- | |
| 03/22/2017 03/22/17 | Sold | $700,000 | +4.6% | $139 / Sq Ft | View Prior Sale |
| 02/23/2017 02/23/17 | Pending | -- | -- | -- | |
| 02/15/2017 02/15/17 | Price Changed | $669,000 | -1.5% | $133 / Sq Ft | |
| 02/07/2017 02/07/17 | Price Changed | $679,000 | -1.5% | $135 / Sq Ft | |
| 12/06/2016 12/06/16 | For Sale | $689,000 | 0.0% | $137 / Sq Ft | |
| 11/19/2016 11/19/16 | Pending | -- | -- | -- | |
| 10/25/2016 10/25/16 | Price Changed | $689,000 | -1.4% | $137 / Sq Ft | |
| 10/06/2016 10/06/16 | Price Changed | $699,000 | -1.5% | $139 / Sq Ft | |
| 09/21/2016 09/21/16 | Price Changed | $709,900 | -0.7% | $141 / Sq Ft | |
| 09/01/2016 09/01/16 | Price Changed | $714,900 | +0.1% | $142 / Sq Ft | |
| 09/01/2016 09/01/16 | Price Changed | $714,000 | -0.8% | $142 / Sq Ft | |
| 08/05/2016 08/05/16 | Price Changed | $719,900 | -0.7% | $143 / Sq Ft | |
| 07/27/2016 07/27/16 | Price Changed | $724,900 | -0.7% | $144 / Sq Ft | |
| 06/30/2016 06/30/16 | Price Changed | $729,900 | -0.6% | $145 / Sq Ft | |
| 06/23/2016 06/23/16 | Price Changed | $734,000 | -0.7% | $146 / Sq Ft | |
| 05/25/2016 05/25/16 | Price Changed | $739,000 | -1.3% | $147 / Sq Ft | |
| 05/12/2016 05/12/16 | Price Changed | $749,000 | -0.8% | $149 / Sq Ft | |
| 05/04/2016 05/04/16 | Price Changed | $755,000 | -1.3% | $150 / Sq Ft | |
| 05/02/2016 05/02/16 | Price Changed | $765,000 | +1.3% | $152 / Sq Ft | |
| 05/02/2016 05/02/16 | Price Changed | $755,000 | -1.3% | $150 / Sq Ft | |
| 04/20/2016 04/20/16 | Price Changed | $765,000 | -1.3% | $152 / Sq Ft | |
| 04/15/2016 04/15/16 | Price Changed | $775,000 | +1.3% | $154 / Sq Ft | |
| 04/15/2016 04/15/16 | Price Changed | $765,000 | -1.3% | $152 / Sq Ft | |
| 03/24/2016 03/24/16 | For Sale | $775,000 | 0.0% | $154 / Sq Ft | |
| 02/28/2016 02/28/16 | Pending | -- | -- | -- | |
| 02/05/2016 02/05/16 | Price Changed | $775,000 | -1.3% | $154 / Sq Ft | |
| 02/01/2016 02/01/16 | For Sale | $785,000 | -- | $156 / Sq Ft |
We collect this data history from publicly available records. To have your information removed, we recommend requesting removal directly through your county’s website.
| Year | Tax Paid | Tax Assessment Tax Assessment Total Assessment is a certain percentage of the fair market value that is determined by local assessors to be the total taxable value of land and additions on the property. | Land | Improvement |
|---|---|---|---|---|
| 2026 | $1,526 | $369,800 | $81,890 | $287,910 |
| 2025 | $14,312 | $369,800 | $81,890 | $287,910 |
| 2024 | $14,312 | $369,800 | $81,890 | $287,910 |
| 2023 | $13,860 | $369,800 | $81,890 | $287,910 |
| 2022 | $13,481 | $367,220 | $81,890 | $285,330 |
| 2021 | $13,154 | $367,220 | $81,890 | $285,330 |
| 2020 | $13,120 | $367,220 | $81,890 | $285,330 |
| 2019 | $12,882 | $367,220 | $81,890 | $285,330 |
| 2018 | $12,845 | $367,220 | $81,890 | $285,330 |
| 2017 | $12,581 | $367,220 | $81,890 | $285,330 |
| 2016 | $1,395 | $367,220 | $81,890 | $285,330 |
| 2015 | $1,395 | $367,220 | $81,890 | $285,330 |
| 2014 | $1,395 | $367,220 | $81,890 | $285,330 |
d
Seller's Agent in 2021
datacorrect BrightMLS
Non Subscribing Office
Buyer's Agent in 2021
Michelle Duran
RE/MAX
(610) 357-1889
110 Total Sales
Seller's Agent in 2017
CJ Stein
Keller Williams Real Estate -Exton
(484) 713-2456
179 Total Sales
E
Seller Co-Listing Agent in 2017
Elizabeth Stein
Keller Williams Real Estate -Exton
(610) 364-8464
57 Total Sales
Buyer's Agent in 2017
Vicky Lawson
Long & Foster
(302) 743-2925
148 Total Sales
Source: Bright MLS
MLS Number: PACT534548
APN: 6303 00960300
Disclaimer: Certain information contained herein is derived from information provided by parties other than Homes.com. All information provided is deemed reliable, but is not guaranteed to be accurate and should be independently verified.
![]() The data relating to real estate for sale on this website appears in part through the BRIGHT Internet Data Exchange program, a voluntary cooperative exchange of property listing data between licensed real estate brokerage firms, and is provided by BRIGHT through a licensing agreement.
The data relating to real estate for sale on this website appears in part through the BRIGHT Internet Data Exchange program, a voluntary cooperative exchange of property listing data between licensed real estate brokerage firms, and is provided by BRIGHT through a licensing agreement.
Listing information is from various brokers who participate in the Bright MLS IDX program and not all listings may be visible on the site.
The property information being provided on or through the website is for the personal, non-commercial use of consumers and such information may not be used for any purpose other than to identify prospective properties consumers may be interested in purchasing.
Some properties which appear for sale on the website may no longer be available because they are for instance, under contract, sold or are no longer being offered for sale.
Property information displayed is deemed reliable but is not guaranteed.
Copyright 2026 Bright MLS, Inc.
Ask me questions while you tour the home.