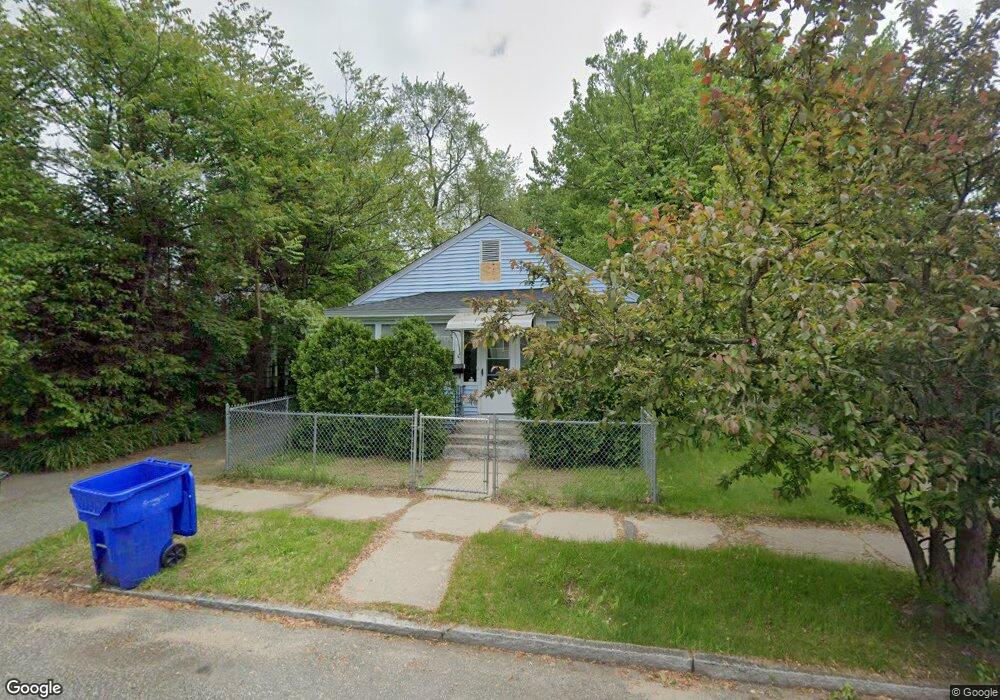
81 Barber St Springfield, MA 01109
Pine Point NeighborhoodEstimated Value: $220,000 - $273,000
2
Beds
1
Bath
874
Sq Ft
$272/Sq Ft
Est. Value
About This Home
This home is located at 81 Barber St, Springfield, MA 01109 and is currently estimated at $237,641, approximately $271 per square foot. 81 Barber St is a home located in Hampden County with nearby schools including Thomas M Balliet Elementary School, John J Duggan Middle, and Roger L. Putnam Vocational Technical Academy.
Ownership History
Date
Name
Owned For
Owner Type
Purchase Details
Closed on
Mar 25, 2003
Sold by
U S Bank Natl Assn
Bought by
Keenan Gail L and Keenan Stephen
Current Estimated Value
Home Financials for this Owner
Home Financials are based on the most recent Mortgage that was taken out on this home.
Original Mortgage
$41,600
Outstanding Balance
$17,910
Interest Rate
5.9%
Mortgage Type
Purchase Money Mortgage
Estimated Equity
$219,731
Purchase Details
Closed on
Nov 6, 2002
Sold by
Corona Maria and Eqcc Home Equity Loan
Bought by
Us Bank Na
Purchase Details
Closed on
Jul 19, 1999
Sold by
Hi Fi Corp
Bought by
Corona Maria
Home Financials for this Owner
Home Financials are based on the most recent Mortgage that was taken out on this home.
Original Mortgage
$56,950
Interest Rate
7.39%
Mortgage Type
Purchase Money Mortgage
Purchase Details
Closed on
Mar 16, 1999
Sold by
Darsch Michael J and Darsch Susan C
Bought by
Hi Fi Corp
Create a Home Valuation Report for This Property
The Home Valuation Report is an in-depth analysis detailing your home's value as well as a comparison with similar homes in the area
Home Values in the Area
Average Home Value in this Area
Purchase History
We collect this data history from publicly available records. To have your information removed, we recommend requesting removal directly through your county’s website.
| Date | Buyer | Sale Price | Title Company |
|---|---|---|---|
| Keenan Gail L | $52,000 | -- | |
| Us Bank Na | $47,600 | -- | |
| Corona Maria | $67,000 | -- | |
| Hi Fi Corp | $12,500 | -- |
Source: Public Records
Mortgage History
We collect this data history from publicly available records. To have your information removed, we recommend requesting removal directly through your county’s website.
| Date | Status | Borrower | Loan Amount |
|---|---|---|---|
| Open | Keenan Gail L | $41,600 | |
| Previous Owner | Hi Fi Corp | $56,950 |
Source: Public Records
Tax History
| Year | Tax Paid | Tax Assessment Tax Assessment Total Assessment is a certain percentage of the fair market value that is determined by local assessors to be the total taxable value of land and additions on the property. | Land | Improvement |
|---|---|---|---|---|
| 2025 | $2,683 | $171,100 | $40,500 | $130,600 |
| 2024 | $2,841 | $176,900 | $33,800 | $143,100 |
| 2023 | $2,503 | $146,800 | $30,700 | $116,100 |
| 2022 | $2,432 | $129,200 | $28,700 | $100,500 |
| 2021 | $2,126 | $112,500 | $26,100 | $86,400 |
| 2020 | $2,117 | $108,400 | $26,100 | $82,300 |
| 2019 | $2,253 | $114,500 | $26,100 | $88,400 |
| 2018 | $2,003 | $101,800 | $26,100 | $75,700 |
| 2017 | $1,976 | $100,500 | $24,100 | $76,400 |
| 2016 | $2,033 | $103,400 | $24,100 | $79,300 |
| 2015 | $1,894 | $96,300 | $24,100 | $72,200 |
Source: Public Records
Map
Nearby Homes
Your Personal Tour Guide
Ask me questions while you tour the home.