81 Perham St West Roxbury, MA 02132
West Roxbury NeighborhoodEstimated Value: $668,759 - $736,000
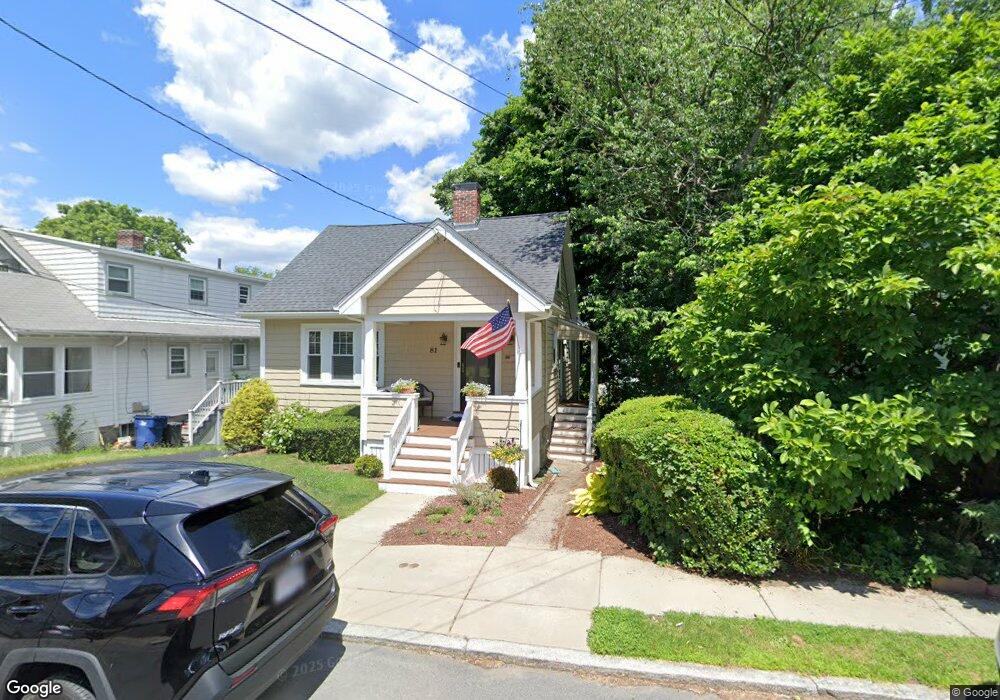
About This Home
This home is located at 81 Perham St, West Roxbury, MA 02132 and is currently estimated at $699,440, approximately $736 per square foot. 81 Perham St is a home located in Suffolk County with nearby schools including St Theresa School, Holy Name Parish School, and Catholic Memorial School.
Ownership History
We collect this data history from publicly available records. To have your information removed, we recommend requesting removal directly through your county’s website.
Purchase Details
Home Financials for this Owner
Home Financials are based on the most recent Mortgage that was taken out on this home.Purchase Details
Purchase Details
Home Values in the Area
Average Home Value in this Area
Purchase History
We collect this data history from publicly available records. To have your information removed, we recommend requesting removal directly through your county’s website.
| Date | Buyer | Sale Price | Title Company |
|---|---|---|---|
| $279,900 | -- | ||
| $152,000 | -- | ||
| $147,000 | -- |
Mortgage History
We collect this data history from publicly available records. To have your information removed, we recommend requesting removal directly through your county’s website.
| Date | Status | Borrower | Loan Amount |
|---|---|---|---|
| Open | $273,774 | ||
| Closed | $223,000 | ||
| Closed | $223,900 | ||
| Previous Owner | $108,600 |
Tax History
We collect this data history from publicly available records. To have your information removed, we recommend requesting removal directly through your county’s website.
| Year | Tax Paid | Tax Assessment Tax Assessment Total Assessment is a certain percentage of the fair market value that is determined by local assessors to be the total taxable value of land and additions on the property. | Land | Improvement |
|---|---|---|---|---|
| 2025 | $7,134 | $616,100 | $238,500 | $377,600 |
| 2024 | $6,148 | $564,000 | $249,400 | $314,600 |
| 2023 | $5,770 | $537,200 | $237,500 | $299,700 |
| 2022 | $5,313 | $488,300 | $215,900 | $272,400 |
| 2021 | $4,934 | $462,400 | $211,700 | $250,700 |
| 2020 | $4,586 | $434,300 | $189,400 | $244,900 |
| 2019 | $4,360 | $413,700 | $159,000 | $254,700 |
| 2018 | $4,015 | $383,100 | $159,000 | $224,100 |
| 2017 | $3,975 | $375,400 | $159,000 | $216,400 |
| 2016 | $4,010 | $364,500 | $159,000 | $205,500 |
| 2015 | $3,905 | $322,500 | $153,700 | $168,800 |
| 2014 | $3,827 | $304,200 | $153,700 | $150,500 |
Map
- 81 Dent St
- 112 Perham St
- 10 Barclay Rd
- 130 Perham St
- 14 Welton Rd
- 186 Temple St
- 11 Sherbrook St
- 481 Lagrange St
- 40 Ivory St
- 177 Perham St
- 425 Lagrange St Unit 210
- 7 Lorette St
- 27 Richwood St
- 460 Baker St
- 52 Park St
- 5 Houston St
- 59 Crest St
- 1216 Vfw Pkwy Unit 40
- 110 Park St Unit 5
- 116 Spring St Unit A8
Ask me questions while you tour the home.