81 Windsor St Roxbury Crossing, MA 02120
Lower Roxbury NeighborhoodEstimated Value: $706,197 - $898,000
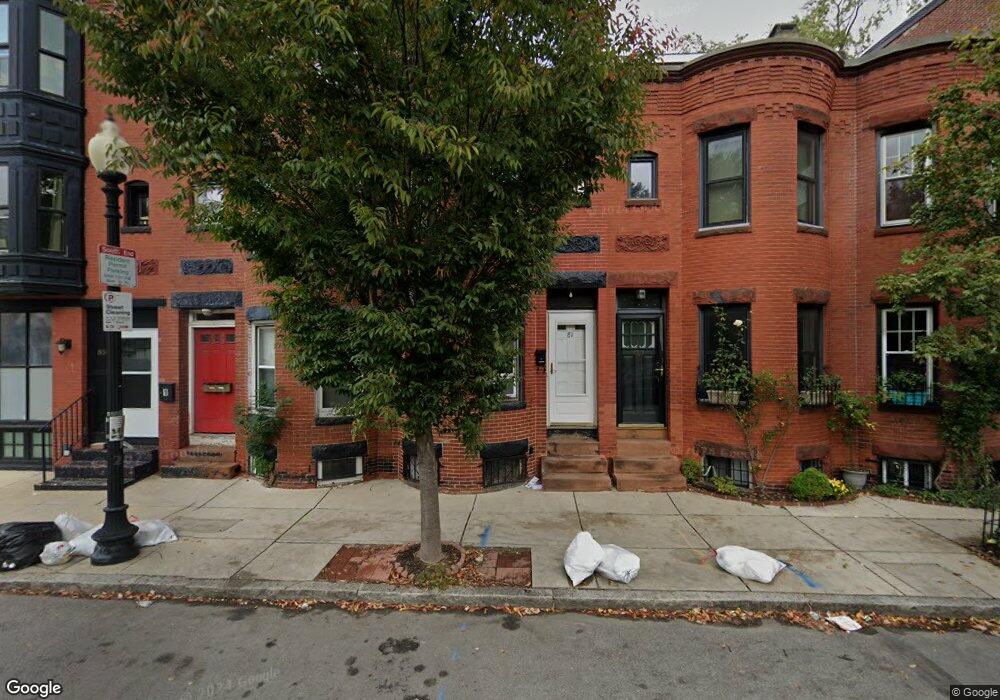
About This Home
This home is located at 81 Windsor St, Roxbury Crossing, MA 02120 and is currently estimated at $767,299, approximately $76 per square foot. 81 Windsor St is a home located in Suffolk County.
Ownership History
We collect this data history from publicly available records. To have your information removed, we recommend requesting removal directly through your county’s website.
Purchase Details
Home Financials for this Owner
Home Financials are based on the most recent Mortgage that was taken out on this home.Purchase Details
Home Financials for this Owner
Home Financials are based on the most recent Mortgage that was taken out on this home.Purchase Details
Home Values in the Area
Average Home Value in this Area
Purchase History
We collect this data history from publicly available records. To have your information removed, we recommend requesting removal directly through your county’s website.
| Date | Buyer | Sale Price | Title Company |
|---|---|---|---|
| $700,000 | None Available | ||
| $440,000 | -- | ||
| $440,000 | -- | ||
| $126,000 | -- | ||
| $126,000 | -- |
Mortgage History
We collect this data history from publicly available records. To have your information removed, we recommend requesting removal directly through your county’s website.
| Date | Status | Borrower | Loan Amount |
|---|---|---|---|
| Open | $557,000 | ||
| Previous Owner | $308,000 | ||
| Previous Owner | $20,000 |
Tax History
We collect this data history from publicly available records. To have your information removed, we recommend requesting removal directly through your county’s website.
| Year | Tax Paid | Tax Assessment Tax Assessment Total Assessment is a certain percentage of the fair market value that is determined by local assessors to be the total taxable value of land and additions on the property. | Land | Improvement |
|---|---|---|---|---|
| 2025 | $6,531 | $564,000 | $137,500 | $426,500 |
| 2024 | $6,095 | $559,200 | $138,100 | $421,100 |
| 2023 | $6,006 | $559,200 | $138,100 | $421,100 |
| 2022 | $5,631 | $517,600 | $127,800 | $389,800 |
| 2021 | $5,415 | $507,500 | $125,300 | $382,200 |
| 2020 | $4,823 | $456,700 | $152,000 | $304,700 |
| 2019 | $4,498 | $426,750 | $120,375 | $306,375 |
| 2018 | $4,180 | $398,875 | $120,375 | $278,500 |
| 2017 | $3,734 | $352,625 | $94,625 | $258,000 |
| 2016 | $3,695 | $335,875 | $94,625 | $241,250 |
| 2015 | $2,395 | $197,800 | $78,600 | $119,200 |
| 2014 | $2,346 | $186,500 | $78,600 | $107,900 |
Map
- 23 Warwick St
- 431 Melnea Cass Blvd
- 1948 Washington St Unit 2G
- 2149 Washington St Unit 604
- 8-14 Newcomb St Unit 4
- 531 Massachusetts Ave Unit 3
- 257 Northampton St Unit 510
- 565 Massachusetts Ave Unit 4
- 473 Massachusetts Ave Unit 2
- 577 Massachusetts Ave Unit 3
- 577 Massachusetts Ave Unit PH
- 514 Massachusetts Ave Unit 5
- 504 Massachusetts Ave Unit 3
- 453 Massachusetts Ave Unit 1
- 617 Massachusetts Ave Unit 1
- 534 Massachusetts Ave Unit 6
- 536 Massachusetts Ave Unit 4
- 578 Massachusetts Ave Unit 4
- 769 Tremont St Unit Parlor
- 10 Taber St Unit 603
- 83 Windsor St
- 83 Windsor St Unit 1
- 83 Windsor St
- 83 Windsor St Unit 2
- 83 Windsor St Unit South End
- 81 Windsor Street Boston Ma 02120
- 81 Windsor St
- 81 Windsor St Unit T
- 81 Windsor St Unit SF
- 81 Windsor St
- 81 Windsor St Unit 81 Windsor St
- 81 Windsor St Unit 1
- 81 Windsor St Unit St
- 81 Windsor St Unit 1
- 81 Windsor St
- 48 Warwick St Unit 2
- 85 Windsor St
- 85 Windsor St Unit 85 Windsor St
- 85 Windsor St Unit 2
- 85 Windsor St
Ask me questions while you tour the home.