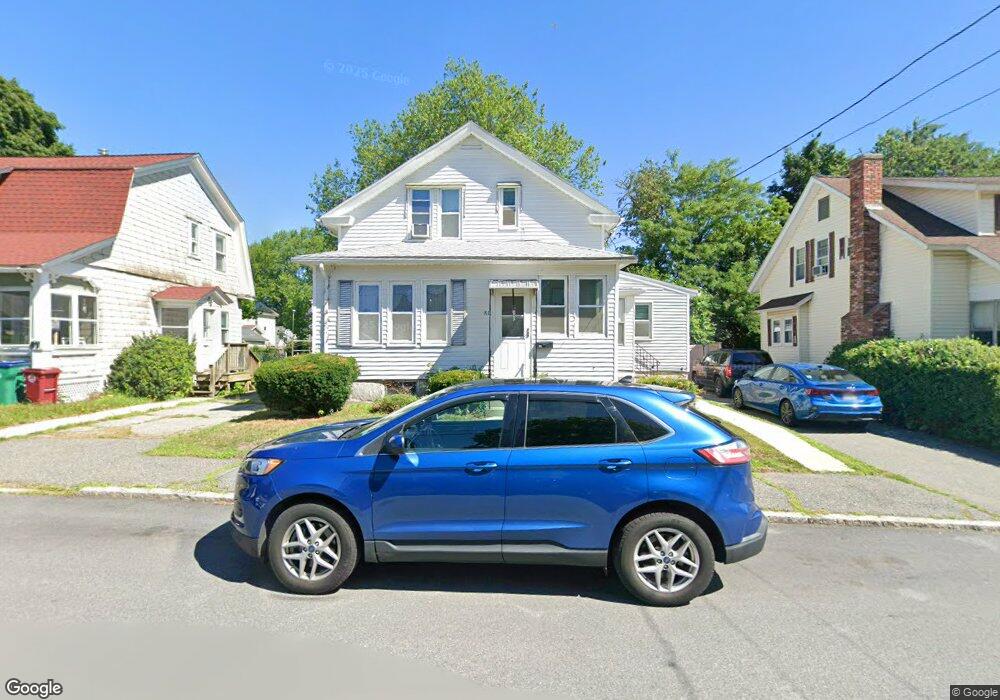
81 Winthrop Ave Lowell, MA 01851
Lower Highlands NeighborhoodEstimated Value: $465,000 - $526,000
3
Beds
3
Baths
1,370
Sq Ft
$360/Sq Ft
Est. Value
About This Home
This home is located at 81 Winthrop Ave, Lowell, MA 01851 and is currently estimated at $493,455, approximately $360 per square foot. 81 Winthrop Ave is a home located in Middlesex County with nearby schools including Abraham Lincoln Elementary School, Charles W. Morey Elementary School, and Dr. Gertrude Bailey Elementary School.
Ownership History
Date
Name
Owned For
Owner Type
Purchase Details
Closed on
Jul 27, 2000
Sold by
Sullivan Joyce
Bought by
Phaneuf Kathleen M
Current Estimated Value
Home Financials for this Owner
Home Financials are based on the most recent Mortgage that was taken out on this home.
Original Mortgage
$132,925
Interest Rate
8.18%
Mortgage Type
Purchase Money Mortgage
Create a Home Valuation Report for This Property
The Home Valuation Report is an in-depth analysis detailing your home's value as well as a comparison with similar homes in the area
Home Values in the Area
Average Home Value in this Area
Purchase History
We collect this data history from publicly available records. To have your information removed, we recommend requesting removal directly through your county’s website.
| Date | Buyer | Sale Price | Title Company |
|---|---|---|---|
| Phaneuf Kathleen M | $162,000 | -- | |
| Phaneuf Kathleen M | $162,000 | -- |
Source: Public Records
Mortgage History
We collect this data history from publicly available records. To have your information removed, we recommend requesting removal directly through your county’s website.
| Date | Status | Borrower | Loan Amount |
|---|---|---|---|
| Open | Phaneuf Kathleen M | $148,000 | |
| Closed | Phaneuf Kathleen M | $132,925 |
Source: Public Records
Tax History
| Year | Tax Paid | Tax Assessment Tax Assessment Total Assessment is a certain percentage of the fair market value that is determined by local assessors to be the total taxable value of land and additions on the property. | Land | Improvement |
|---|---|---|---|---|
| 2025 | $4,771 | $415,600 | $179,800 | $235,800 |
| 2024 | $4,651 | $390,500 | $168,000 | $222,500 |
| 2023 | $4,361 | $351,100 | $146,100 | $205,000 |
| 2022 | $4,018 | $316,600 | $132,800 | $183,800 |
| 2021 | $3,747 | $278,400 | $115,500 | $162,900 |
| 2020 | $3,455 | $258,600 | $103,700 | $154,900 |
| 2019 | $3,298 | $234,900 | $102,700 | $132,200 |
| 2018 | $3,225 | $224,100 | $97,800 | $126,300 |
| 2017 | $3,202 | $214,600 | $94,800 | $119,800 |
| 2016 | $2,962 | $195,400 | $85,400 | $110,000 |
Source: Public Records
Map
Nearby Homes
Your Personal Tour Guide
Ask me questions while you tour the home.