Estimated Value: $166,000 - $266,281
3
Beds
2
Baths
2,496
Sq Ft
$93/Sq Ft
Est. Value
About This Home
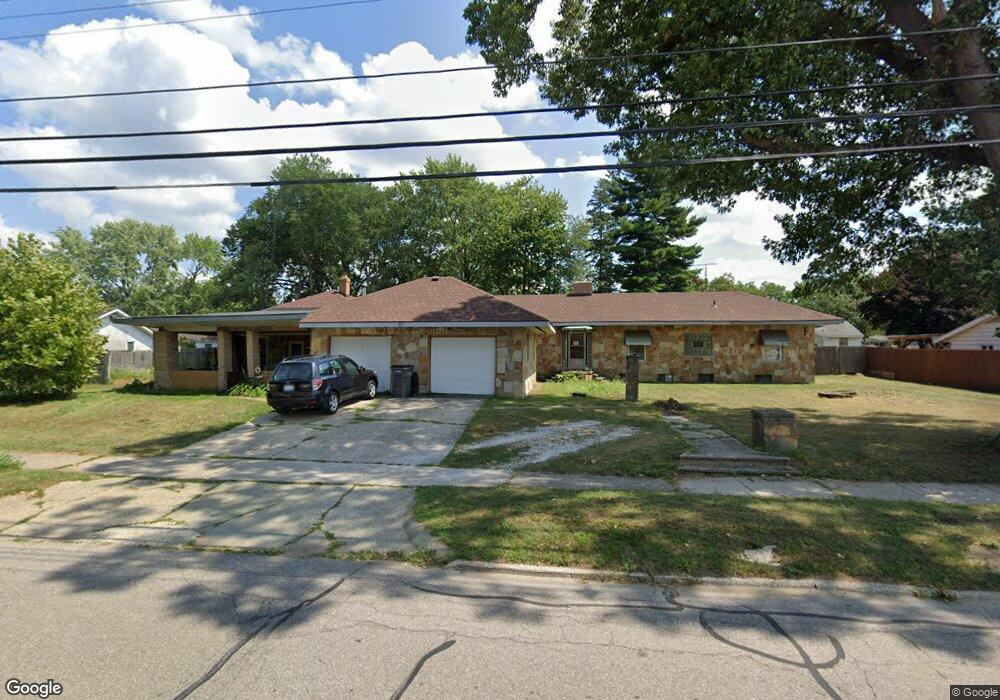
This home is located at 811 S 15th St, Niles, MI 49120 and is currently estimated at $232,070, approximately $92 per square foot. 811 S 15th St is a home located in Berrien County with nearby schools including Ballard Elementary School, Oak Manor Sixth Grade Center, and Ring Lardner Middle School.
Ownership History
Date
Name
Owned For
Owner Type
Purchase Details
Closed on
Mar 8, 2007
Sold by
Borden Dixie L
Bought by
Deutsche Bank National Trust Co
Current Estimated Value
Purchase Details
Closed on
Aug 19, 2005
Sold by
Borden Dixie Lee
Bought by
Borden Dixie L
Home Financials for this Owner
Home Financials are based on the most recent Mortgage that was taken out on this home.
Original Mortgage
$56,000
Interest Rate
5.82%
Mortgage Type
New Conventional
Purchase Details
Closed on
Dec 28, 1983
Purchase Details
Closed on
Apr 17, 1978
Create a Home Valuation Report for This Property
The Home Valuation Report is an in-depth analysis detailing your home's value as well as a comparison with similar homes in the area
Home Values in the Area
Average Home Value in this Area
Purchase History
We collect this data history from publicly available records. To have your information removed, we recommend requesting removal directly through your county’s website.
| Date | Buyer | Sale Price | Title Company |
|---|---|---|---|
| Deutsche Bank National Trust Co | $61,827 | None Available | |
| Borden Dixie L | -- | Nations Title Agency Of Mi | |
| -- | -- | -- | |
| -- | $42,500 | -- |
Source: Public Records
Mortgage History
We collect this data history from publicly available records. To have your information removed, we recommend requesting removal directly through your county’s website.
| Date | Status | Borrower | Loan Amount |
|---|---|---|---|
| Previous Owner | Borden Dixie L | $56,000 |
Source: Public Records
Tax History
| Year | Tax Paid | Tax Assessment Tax Assessment Total Assessment is a certain percentage of the fair market value that is determined by local assessors to be the total taxable value of land and additions on the property. | Land | Improvement |
|---|---|---|---|---|
| 2025 | $2,230 | $130,100 | $0 | $0 |
| 2024 | $1,767 | $121,200 | $0 | $0 |
| 2023 | $1,694 | $85,800 | $0 | $0 |
| 2022 | $1,614 | $78,900 | $0 | $0 |
| 2021 | $1,969 | $74,100 | $4,300 | $69,800 |
| 2020 | $1,948 | $61,000 | $0 | $0 |
| 2019 | $1,924 | $55,400 | $4,600 | $50,800 |
| 2018 | $1,860 | $55,400 | $0 | $0 |
| 2017 | $1,829 | $59,800 | $0 | $0 |
| 2016 | $1,790 | $54,100 | $0 | $0 |
| 2015 | $1,784 | $50,100 | $0 | $0 |
| 2014 | $1,401 | $50,100 | $0 | $0 |
Source: Public Records
Map
Nearby Homes
- 1515 Inner Dr
- 1408 Silverbrook Ave
- 1638 Superior St
- 324 S 15th St
- 1893 Lewis Dr
- 949 S 13th St
- 1250 S 15th St
- 1303 Marion St
- 1621 Maple St
- 1917 E Main St
- 1648 Oak St
- 400 Carefree Ct
- VL Huron St
- 2112 Kathryn Dr
- 627 S 5th St
- V/L Kathryn St Unit Tract 3
- 1008 Oak St
- 115 Stowe Ct
- V/L S 3rd St
- 0 Kathryn St Unit Tract 1
- 825 Federal Ct
- 821 Federal Ct
- 831 Federal Ct
- 835 S 15th St
- 831 S 15th St
- 821 S 15th St
- 1510 Silverbrook Ave
- 1512 Silverbrook Ave
- 819 Federal Ct
- 841 Federal Ct
- 1516 Silverbrook Ave
- 1635 S 15th St
- 1530 Inner Dr
- 911 S 15th St
- 1540 Inner Dr
- 1522 Inner Dr
- 1518 Silverbrook Ave
- 1518 Inner Dr
- 805 S 15th St
- 1529 Inner Dr
Your Personal Tour Guide
Ask me questions while you tour the home.