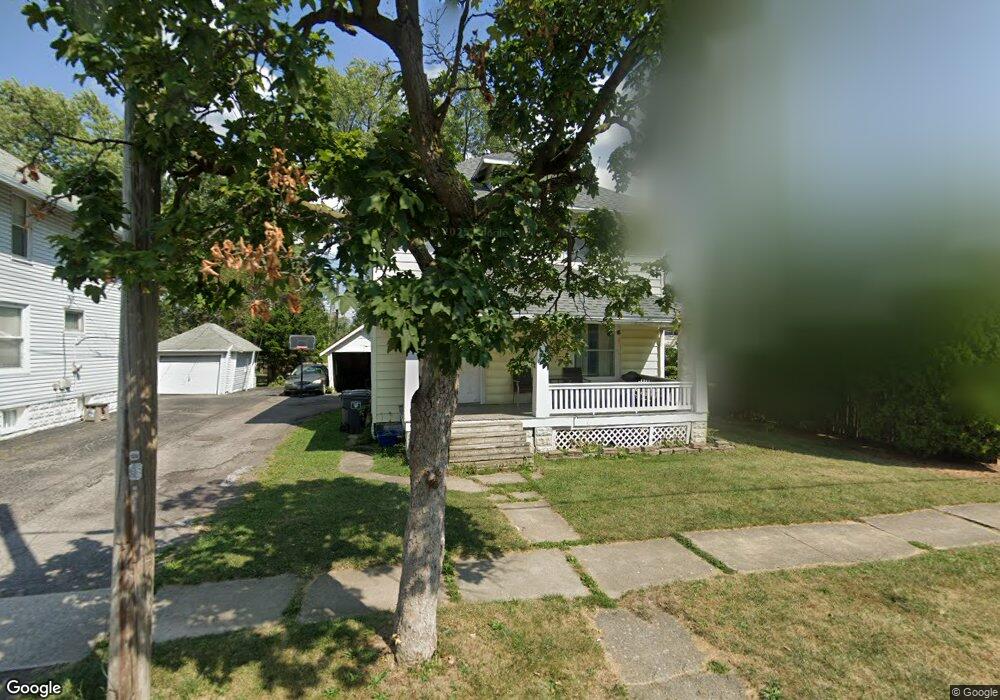
812 N Charles St Lima, OH 45805
Central Lima NeighborhoodEstimated Value: $59,000 - $99,922
3
Beds
1
Bath
1,359
Sq Ft
$59/Sq Ft
Est. Value
About This Home
This home is located at 812 N Charles St, Lima, OH 45805 and is currently estimated at $79,981, approximately $58 per square foot. 812 N Charles St is a home located in Allen County with nearby schools including Heritage Elementary School, Lima North Middle School, and Lima West Middle School.
Ownership History
Date
Name
Owned For
Owner Type
Purchase Details
Closed on
Mar 16, 2023
Sold by
Neth Properties Llc
Bought by
Blue Chip Housing Llc
Current Estimated Value
Home Financials for this Owner
Home Financials are based on the most recent Mortgage that was taken out on this home.
Original Mortgage
$1,110,028
Outstanding Balance
$446,614
Interest Rate
6.09%
Mortgage Type
Purchase Money Mortgage
Estimated Equity
-$366,633
Purchase Details
Closed on
May 31, 2011
Sold by
Nalley Michael T and Nalley Ann M
Bought by
Neth Properties Llc
Purchase Details
Closed on
Nov 13, 1997
Sold by
Weakland Jerry
Bought by
Nalley Michael and Nalley Ann
Purchase Details
Closed on
May 2, 1991
Bought by
Weakland Jerry E
Create a Home Valuation Report for This Property
The Home Valuation Report is an in-depth analysis detailing your home's value as well as a comparison with similar homes in the area
Home Values in the Area
Average Home Value in this Area
Purchase History
We collect this data history from publicly available records. To have your information removed, we recommend requesting removal directly through your county’s website.
| Date | Buyer | Sale Price | Title Company |
|---|---|---|---|
| Blue Chip Housing Llc | $1,304,000 | None Listed On Document | |
| Neth Properties Llc | $23,500 | Attorney | |
| Nalley Michael | $31,000 | -- | |
| Weakland Jerry E | $24,000 | -- |
Source: Public Records
Mortgage History
We collect this data history from publicly available records. To have your information removed, we recommend requesting removal directly through your county’s website.
| Date | Status | Borrower | Loan Amount |
|---|---|---|---|
| Open | Blue Chip Housing Llc | $1,110,028 |
Source: Public Records
Tax History
| Year | Tax Paid | Tax Assessment Tax Assessment Total Assessment is a certain percentage of the fair market value that is determined by local assessors to be the total taxable value of land and additions on the property. | Land | Improvement |
|---|---|---|---|---|
| 2024 | $592 | $14,990 | $1,930 | $13,060 |
| 2023 | $593 | $13,130 | $1,680 | $11,450 |
| 2022 | $595 | $13,130 | $1,680 | $11,450 |
| 2021 | $629 | $13,130 | $1,680 | $11,450 |
| 2020 | $387 | $6,660 | $1,650 | $5,010 |
| 2019 | $387 | $6,660 | $1,650 | $5,010 |
| 2018 | $386 | $6,660 | $1,650 | $5,010 |
| 2017 | $388 | $6,660 | $1,650 | $5,010 |
| 2016 | $394 | $6,660 | $1,650 | $5,010 |
| 2015 | $456 | $6,660 | $1,650 | $5,010 |
| 2014 | $456 | $7,810 | $1,720 | $6,090 |
| 2013 | $445 | $7,810 | $1,720 | $6,090 |
Source: Public Records
Map
Nearby Homes
- 949 Leland Ave
- 1023 Leland Ave
- 953 Rice Ave
- 625 N Charles St
- 618 Woodward Ave
- 703 N Collett St
- 1031 Richie Ave
- 513 N Charles St
- 524 N Jameson Ave
- 615 N Collett St
- 503 N Charles St
- 711 College Ave
- 0 Latham
- 623 Hazel Ave
- 1160 Richie Ave
- 1027 Brice Ave
- 806 Ewing Ave
- 1023 Brice Ave
- 777 Ewing Ave
- 508 N Collett St
- 816 N Charles St
- 948 Leland Ave
- 950 Leland Ave
- 944 Leland Ave
- 942 Leland Ave
- 1002 Leland Ave
- 820 N Charles St
- 987 Hazel Ave
- 985 Hazel Ave
- 940 Leland Ave
- 852 Hazel Ave
- 809 N Charles St
- 1008 Leland Ave
- 938 Leland Ave
- 823 N Charles St
- 975 Delphos Ave
- 1010 Leland Ave
- 815 N Charles St
- 955 Leland Ave
- 936 Leland Ave
Your Personal Tour Guide
Ask me questions while you tour the home.