813 Dixie St Liberty, MO 64068
Estimated Value: $234,284 - $258,000
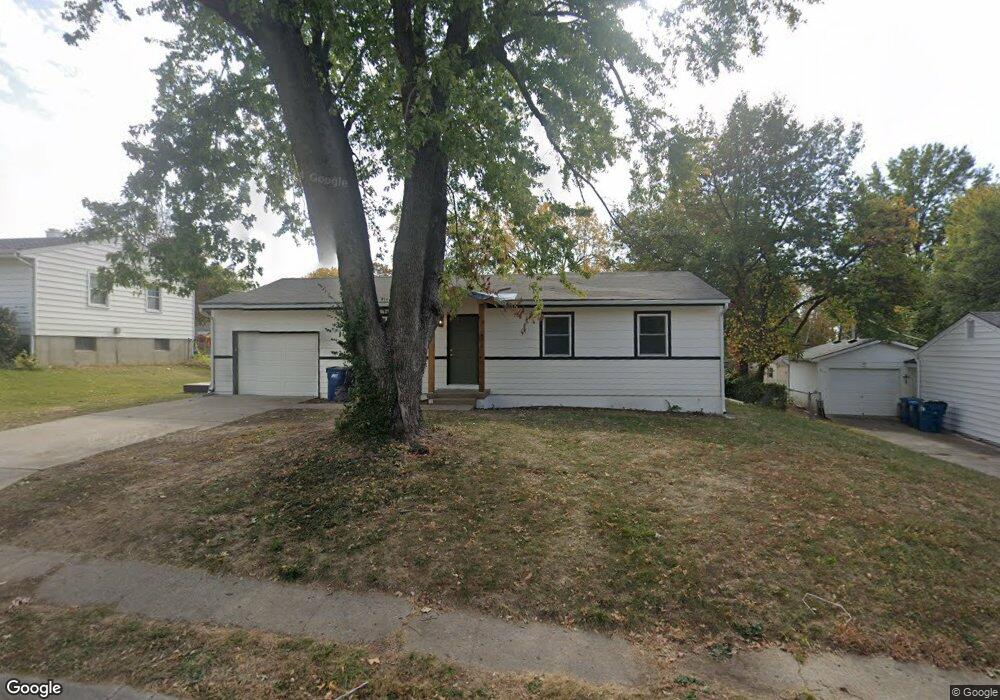
About This Home
This home is located at 813 Dixie St, Liberty, MO 64068 and is currently estimated at $245,321, approximately $164 per square foot. 813 Dixie St is a home located in Clay County with nearby schools including Ridgeview Elementary School, Heritage Middle School, and Liberty North High School.
Ownership History
We collect this data history from publicly available records. To have your information removed, we recommend requesting removal directly through your county’s website.
Purchase Details
Home Financials for this Owner
Home Financials are based on the most recent Mortgage that was taken out on this home.Purchase Details
Home Financials for this Owner
Home Financials are based on the most recent Mortgage that was taken out on this home.Home Values in the Area
Average Home Value in this Area
Purchase History
We collect this data history from publicly available records. To have your information removed, we recommend requesting removal directly through your county’s website.
| Date | Buyer | Sale Price | Title Company |
|---|---|---|---|
| -- | Stewart Title | ||
| -- | Stewart Title | ||
| -- | First American Title Ins Co |
Mortgage History
We collect this data history from publicly available records. To have your information removed, we recommend requesting removal directly through your county’s website.
| Date | Status | Borrower | Loan Amount |
|---|---|---|---|
| Closed | $192,000 | ||
| Previous Owner | $75,000 |
Tax History
We collect this data history from publicly available records. To have your information removed, we recommend requesting removal directly through your county’s website.
| Year | Tax Paid | Tax Assessment Tax Assessment Total Assessment is a certain percentage of the fair market value that is determined by local assessors to be the total taxable value of land and additions on the property. | Land | Improvement |
|---|---|---|---|---|
| 2025 | $1,945 | $27,060 | -- | -- |
| 2024 | $2,092 | $24,280 | -- | -- |
| 2023 | $2,124 | $24,280 | $0 | $0 |
| 2022 | $1,846 | $21,470 | $0 | $0 |
| 2021 | $1,812 | $21,470 | $5,320 | $16,150 |
| 2020 | $1,684 | $20,120 | $0 | $0 |
| 2019 | $1,684 | $20,121 | $4,750 | $15,371 |
| 2018 | $1,409 | $16,530 | $0 | $0 |
| 2017 | $1,396 | $16,530 | $3,040 | $13,490 |
| 2016 | $1,396 | $16,530 | $3,040 | $13,490 |
| 2015 | $1,396 | $16,530 | $3,040 | $13,490 |
| 2014 | $1,702 | $19,990 | $3,040 | $16,950 |
Map
- 656 Thornton St
- 506 Moss Ave
- 809 Lindenwood Ln
- 1116 Owen Dr
- 138 S Terrace Ave
- 1308 Middlebrook Dr
- 400 W Murray St
- 110 N Ridge Ave
- 194 N Camelot Dr
- 730 W College St
- 1509 Wynbrick Dr
- 212 Jackson Ave
- 1524 Oxford Ct
- 202 Meade St
- 30 S Village Dr
- 1501 Johnston St
- 128 E Brown St
- 1505 Ashton Dr
- 400 S Missouri St
- 1437 Coventry Ln
Ask me questions while you tour the home.