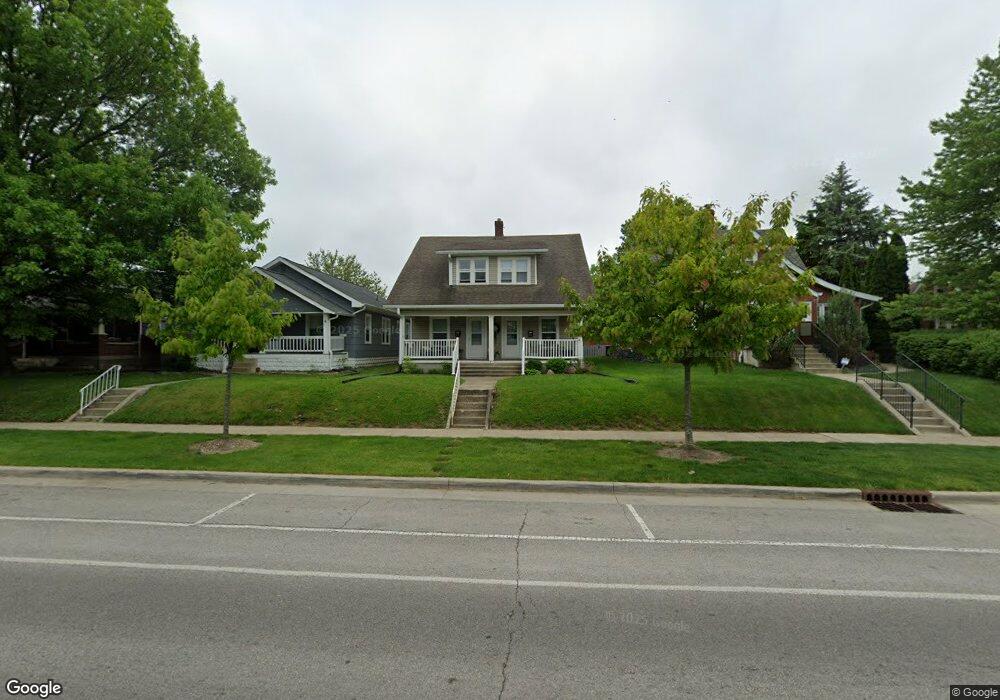
813 Main St Beech Grove, IN 46107
Estimated Value: $118,000 - $240,000
2
Beds
1
Bath
1,188
Sq Ft
$150/Sq Ft
Est. Value
About This Home
This home is located at 813 Main St, Beech Grove, IN 46107 and is currently estimated at $178,768, approximately $150 per square foot. 813 Main St is a home located in Marion County with nearby schools including Hornet Park Elementary School, Central Elementary School, and South Grove Intermediate School.
Ownership History
Date
Name
Owned For
Owner Type
Purchase Details
Closed on
Jun 12, 2015
Sold by
Bg Quads Llc
Bought by
Mcnair Thad R and Mcnair Joann
Current Estimated Value
Home Financials for this Owner
Home Financials are based on the most recent Mortgage that was taken out on this home.
Original Mortgage
$67,500
Interest Rate
3.82%
Mortgage Type
New Conventional
Purchase Details
Closed on
Mar 1, 2012
Sold by
Masterson Michael A and Masterson Amy Jones
Bought by
Bg Quads Llc
Create a Home Valuation Report for This Property
The Home Valuation Report is an in-depth analysis detailing your home's value as well as a comparison with similar homes in the area
Home Values in the Area
Average Home Value in this Area
Purchase History
| Date | Buyer | Sale Price | Title Company |
|---|---|---|---|
| Mcnair Thad R | -- | First American Title Ins Co | |
| Bg Quads Llc | -- | None Available |
Source: Public Records
Mortgage History
| Date | Status | Borrower | Loan Amount |
|---|---|---|---|
| Previous Owner | Mcnair Thad R | $67,500 |
Source: Public Records
Tax History
| Year | Tax Paid | Tax Assessment Tax Assessment Total Assessment is a certain percentage of the fair market value that is determined by local assessors to be the total taxable value of land and additions on the property. | Land | Improvement |
|---|---|---|---|---|
| 2025 | $6,847 | $254,900 | $17,500 | $237,400 |
| 2024 | $6,140 | $248,500 | $17,500 | $231,000 |
| 2023 | $6,140 | $220,100 | $17,500 | $202,600 |
| 2022 | $5,795 | $202,500 | $17,500 | $185,000 |
| 2021 | $4,729 | $170,700 | $17,500 | $153,200 |
| 2020 | $3,972 | $152,500 | $17,500 | $135,000 |
| 2019 | $3,543 | $141,200 | $7,200 | $134,000 |
| 2018 | $2,936 | $121,200 | $7,200 | $114,000 |
| 2017 | $2,975 | $118,800 | $7,200 | $111,600 |
| 2016 | $2,846 | $114,800 | $7,200 | $107,600 |
| 2014 | $2,418 | $102,800 | $7,200 | $95,600 |
| 2013 | $2,117 | $90,000 | $7,200 | $82,800 |
Source: Public Records
Map
Nearby Homes
Your Personal Tour Guide
Ask me questions while you tour the home.