8130 Comox Loop Blaine, WA 98230
Estimated Value: $514,000 - $602,000
About This Home
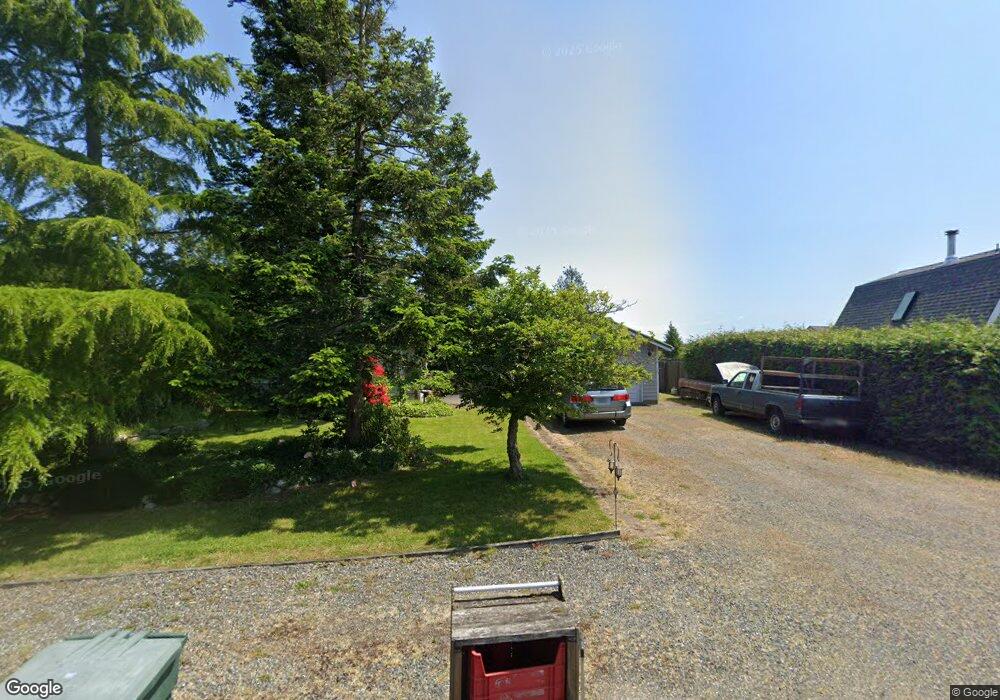
This home is located at 8130 Comox Loop, Blaine, WA 98230 and is currently estimated at $538,452, approximately $451 per square foot. 8130 Comox Loop is a home located in Whatcom County with nearby schools including Blaine Primary School, Blaine Elementary School, and Blaine Middle School.
Ownership History
We collect this data history from publicly available records. To have your information removed, we recommend requesting removal directly through your county’s website.
Purchase Details
Purchase Details
Purchase Details
Home Financials for this Owner
Home Financials are based on the most recent Mortgage that was taken out on this home.Purchase History
We collect this data history from publicly available records. To have your information removed, we recommend requesting removal directly through your county’s website.
| Date | Buyer | Sale Price | Title Company |
|---|---|---|---|
| -- | Chicago Title Insurance | ||
| $122,467 | Chicago Title Insurance Co | ||
| -- | Chicago Title Insurance |
Mortgage History
We collect this data history from publicly available records. To have your information removed, we recommend requesting removal directly through your county’s website.
| Date | Status | Borrower | Loan Amount |
|---|---|---|---|
| Previous Owner | $72,800 |
Tax History
We collect this data history from publicly available records. To have your information removed, we recommend requesting removal directly through your county’s website.
| Year | Tax Paid | Tax Assessment Tax Assessment Total Assessment is a certain percentage of the fair market value that is determined by local assessors to be the total taxable value of land and additions on the property. | Land | Improvement |
|---|---|---|---|---|
| 2025 | $3,413 | $480,243 | $232,942 | $247,301 |
| 2024 | $3,279 | $475,467 | $230,625 | $244,842 |
| 2023 | $3,279 | $475,467 | $230,625 | $244,842 |
| 2022 | $2,728 | $422,637 | $205,000 | $217,637 |
| 2021 | $2,597 | $300,210 | $114,352 | $185,858 |
| 2020 | $2,537 | $263,345 | $100,310 | $163,035 |
| 2019 | $2,314 | $247,853 | $94,409 | $153,444 |
| 2018 | $2,250 | $220,287 | $83,909 | $136,378 |
| 2017 | $1,926 | $193,144 | $73,570 | $119,574 |
| 2016 | $1,929 | $183,772 | $70,000 | $113,772 |
| 2015 | $1,891 | $177,262 | $70,259 | $107,003 |
| 2014 | -- | $169,635 | $67,235 | $102,400 |
| 2013 | -- | $167,784 | $66,500 | $101,284 |
Map
- 8141 Comox Rd
- 8149 Skeena Way
- 10 Skeena Way
- 8091 Kispiox Rd
- 8103 Kayak Way
- 8068 Niska Rd
- 8171 Quinault Rd
- 8209 Comox Rd
- 8120 Kitamat Way
- 8123 Coquitlam Place
- 0 Kispiox Rd
- 5606 Chehalis Place
- 8062 Kayak Way
- 8037 Chinook Way
- 8243 Chilliwack Rd
- 8255 Quinault Rd
- 0 Skagit Way
- 8216 Chehalis Rd
- 8227 Sehome Rd
- 5727 Nakat Way
- 8131 Comox Loop
- 8135 Comox Loop
- 0 L27 Comox Loop
- 0 Lot 37 Comox Loop
- 36 Comox Loop
- 8139 Comox Loop
- 8123 Comox Loop
- 8126 Comox Loop
- 8120 Comox Loop
- 8141 Comox Loop
- 8134 Skeena Way
- 8138 Comox Loop
- 8112 Comox Loop
- 8128 Skeena Way
- 8135 Comox Rd
- 8122 Skeena Way
- 8119 Comox Rd
- 0 Comox Lp Unit 810684
- 0 Comox Lp Unit 96270
- 0 Comox Lp Unit 1215169
Ask me questions while you tour the home.