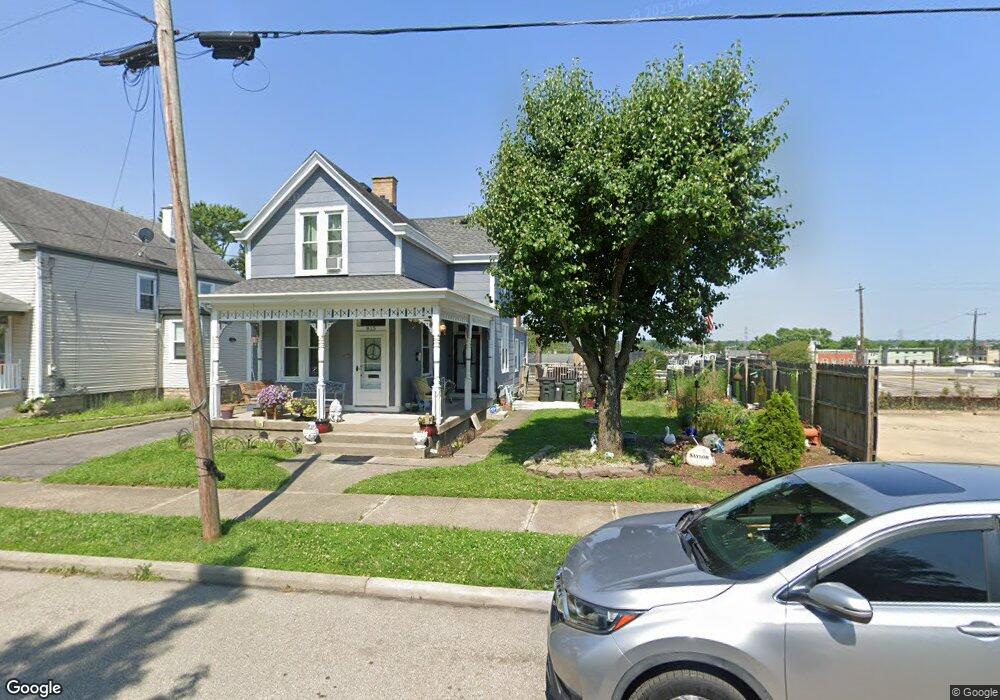
815 3rd St Cincinnati, OH 45215
Estimated Value: $128,000 - $187,000
2
Beds
1
Bath
1,239
Sq Ft
$129/Sq Ft
Est. Value
About This Home
This home is located at 815 3rd St, Cincinnati, OH 45215 and is currently estimated at $159,677, approximately $128 per square foot. 815 3rd St is a home located in Hamilton County with nearby schools including Reading Community High School, Saints Peter and Paul Academy, and Mount Notre Dame High School.
Ownership History
Date
Name
Owned For
Owner Type
Purchase Details
Closed on
Aug 10, 2018
Sold by
Er Properties Ltd
Bought by
Saylor Judith A
Current Estimated Value
Home Financials for this Owner
Home Financials are based on the most recent Mortgage that was taken out on this home.
Original Mortgage
$50,076
Outstanding Balance
$43,370
Interest Rate
4.75%
Mortgage Type
FHA
Estimated Equity
$116,307
Purchase Details
Closed on
Feb 14, 2000
Sold by
Eva Becker
Bought by
E R Properties Ltd
Create a Home Valuation Report for This Property
The Home Valuation Report is an in-depth analysis detailing your home's value as well as a comparison with similar homes in the area
Home Values in the Area
Average Home Value in this Area
Purchase History
| Date | Buyer | Sale Price | Title Company |
|---|---|---|---|
| Saylor Judith A | $51,000 | None Available | |
| E R Properties Ltd | $39,500 | -- |
Source: Public Records
Mortgage History
| Date | Status | Borrower | Loan Amount |
|---|---|---|---|
| Open | Saylor Judith A | $50,076 |
Source: Public Records
Tax History
| Year | Tax Paid | Tax Assessment Tax Assessment Total Assessment is a certain percentage of the fair market value that is determined by local assessors to be the total taxable value of land and additions on the property. | Land | Improvement |
|---|---|---|---|---|
| 2025 | $1,571 | $28,938 | $7,917 | $21,021 |
| 2023 | $1,569 | $28,938 | $7,917 | $21,021 |
| 2022 | $1,246 | $17,851 | $6,367 | $11,484 |
| 2021 | $1,066 | $17,851 | $6,367 | $11,484 |
| 2020 | $1,051 | $17,851 | $6,367 | $11,484 |
| 2019 | $1,020 | $15,740 | $5,635 | $10,105 |
| 2018 | $1,021 | $15,740 | $5,635 | $10,105 |
| 2017 | $975 | $15,740 | $5,635 | $10,105 |
| 2016 | $1,289 | $20,637 | $5,968 | $14,669 |
| 2015 | $1,282 | $20,637 | $5,968 | $14,669 |
| 2014 | $1,127 | $20,637 | $5,968 | $14,669 |
| 2013 | $1,142 | $21,060 | $6,090 | $14,970 |
Source: Public Records
Map
Nearby Homes
Your Personal Tour Guide
Ask me questions while you tour the home.