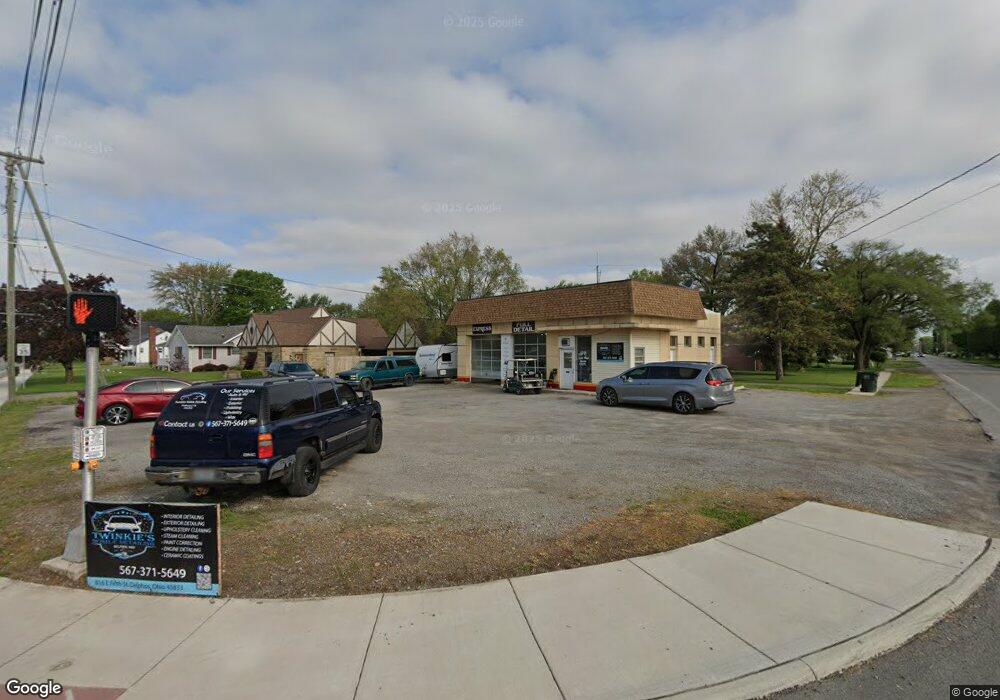
816 E 5th St Delphos, OH 45833
Estimated Value: $114,520
Studio
1
Bath
1,134
Sq Ft
$101/Sq Ft
Est. Value
About This Home
This home is located at 816 E 5th St, Delphos, OH 45833 and is currently estimated at $114,520, approximately $100 per square foot. 816 E 5th St is a home located in Allen County with nearby schools including Delphos St. John's High School and Delphos St. John's Elementary School.
Ownership History
Date
Name
Owned For
Owner Type
Purchase Details
Closed on
Apr 18, 2022
Sold by
Stump Baby Llc
Bought by
Maag Kyle J
Current Estimated Value
Purchase Details
Closed on
Aug 28, 2020
Sold by
Stump Baby Llc
Bought by
City Of Delphos
Purchase Details
Closed on
Sep 27, 2019
Bought by
Stump Baby Llc
Purchase Details
Closed on
Dec 20, 2013
Sold by
German Virgil F
Bought by
Stump Baby Llc
Purchase Details
Closed on
Aug 1, 1978
Bought by
German Virgil F
Create a Home Valuation Report for This Property
The Home Valuation Report is an in-depth analysis detailing your home's value as well as a comparison with similar homes in the area
Home Values in the Area
Average Home Value in this Area
Purchase History
| Date | Buyer | Sale Price | Title Company |
|---|---|---|---|
| Maag Kyle J | $90,000 | Clark Alex J | |
| City Of Delphos | -- | None Available | |
| Stump Baby Llc | -- | -- | |
| Stump Baby Llc | -- | None Available | |
| German Virgil F | $20,000 | -- |
Source: Public Records
Tax History
| Year | Tax Paid | Tax Assessment Tax Assessment Total Assessment is a certain percentage of the fair market value that is determined by local assessors to be the total taxable value of land and additions on the property. | Land | Improvement |
|---|---|---|---|---|
| 2024 | $1,153 | $21,220 | $9,910 | $11,310 |
| 2023 | $1,114 | $19,290 | $9,000 | $10,290 |
| 2022 | $1,149 | $19,290 | $9,000 | $10,290 |
| 2021 | $1,156 | $19,290 | $9,000 | $10,290 |
| 2020 | $1,048 | $19,010 | $12,010 | $7,000 |
| 2019 | $1,048 | $19,010 | $12,010 | $7,000 |
| 2018 | $1,035 | $19,010 | $12,010 | $7,000 |
| 2017 | $1,011 | $19,010 | $12,010 | $7,000 |
| 2016 | $1,029 | $19,010 | $12,010 | $7,000 |
| 2015 | $999 | $19,010 | $12,010 | $7,000 |
| 2014 | $999 | $20,170 | $13,340 | $6,830 |
| 2013 | $969 | $20,170 | $13,340 | $6,830 |
Source: Public Records
Map
Nearby Homes
- 821 E 3rd St
- 628 N Pierce St
- 201 E 5th St
- 610 N Washington St
- 702 N Main St
- 221 S Main St
- 1000 Colettas Way
- 483 S Franklin St
- 424 S Canal St
- 709 W 4th St
- 537 / 539 Toomey
- 827 S Washington St
- 6800 N Defiance Trail
- 8448 Elida Rd
- 3755 Grubb Rd N
- 180 3rd St
- 608 N Adams St
- 0 N Conant Rd
- 19195 State Rd
- 19391 Road R
Your Personal Tour Guide
Ask me questions while you tour the home.