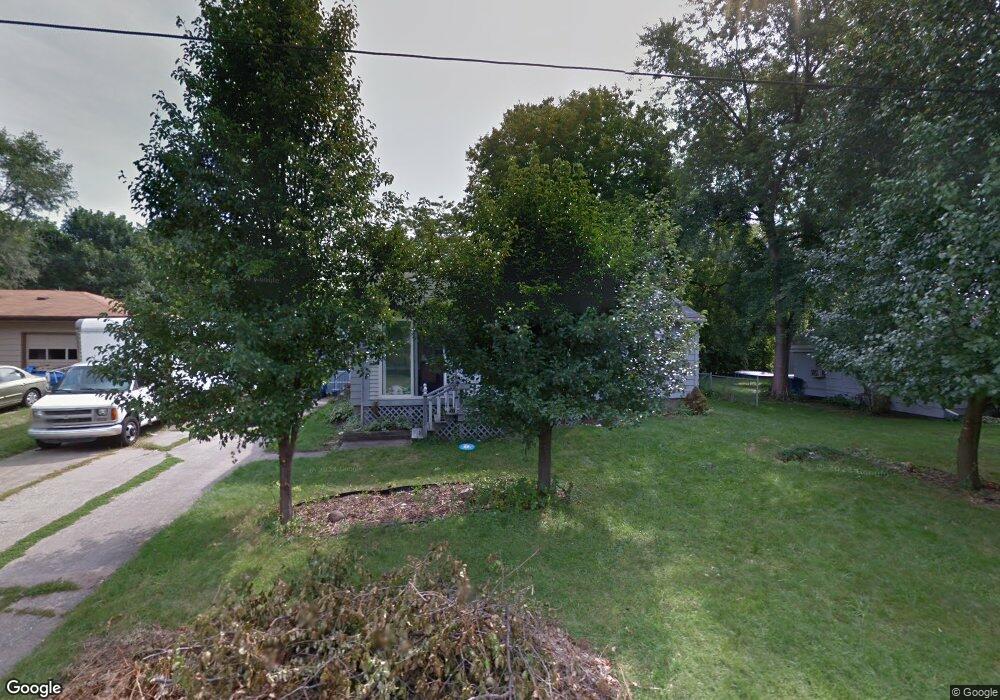
817 Eason Ct La Porte, IN 46350
Estimated Value: $121,000 - $224,000
2
Beds
2
Baths
1,052
Sq Ft
$173/Sq Ft
Est. Value
About This Home
This home is located at 817 Eason Ct, La Porte, IN 46350 and is currently estimated at $181,585, approximately $172 per square foot. 817 Eason Ct is a home located in LaPorte County with nearby schools including Handley Elementary School, La Porte High School, and Kesling Intermediate School.
Ownership History
Date
Name
Owned For
Owner Type
Purchase Details
Closed on
Jan 13, 2026
Sold by
Cole Thomas E
Bought by
Cole Thomas E
Current Estimated Value
Purchase Details
Closed on
Oct 30, 2012
Sold by
Cole Thomas E and Cole Elaine
Bought by
Cole Thomas E
Purchase Details
Closed on
Nov 5, 2008
Sold by
Lewis Deborah L
Bought by
Cole Thomas E and Cole Elaine S
Home Financials for this Owner
Home Financials are based on the most recent Mortgage that was taken out on this home.
Original Mortgage
$56,000
Interest Rate
6.09%
Mortgage Type
Unknown
Create a Home Valuation Report for This Property
The Home Valuation Report is an in-depth analysis detailing your home's value as well as a comparison with similar homes in the area
Home Values in the Area
Average Home Value in this Area
Purchase History
We collect this data history from publicly available records. To have your information removed, we recommend requesting removal directly through your county’s website.
| Date | Buyer | Sale Price | Title Company |
|---|---|---|---|
| Cole Thomas E | -- | None Listed On Document | |
| Cole Thomas E | $76,000 | None Available | |
| Cole Thomas E | -- | Chicago Title Insurance Co |
Source: Public Records
Mortgage History
We collect this data history from publicly available records. To have your information removed, we recommend requesting removal directly through your county’s website.
| Date | Status | Borrower | Loan Amount |
|---|---|---|---|
| Previous Owner | Cole Thomas E | $56,000 |
Source: Public Records
Tax History
| Year | Tax Paid | Tax Assessment Tax Assessment Total Assessment is a certain percentage of the fair market value that is determined by local assessors to be the total taxable value of land and additions on the property. | Land | Improvement |
|---|---|---|---|---|
| 2025 | $1,279 | $126,200 | $19,700 | $106,500 |
| 2024 | $1,170 | $120,000 | $19,700 | $100,300 |
| 2022 | $1,008 | $100,800 | $16,400 | $84,400 |
| 2021 | $955 | $95,500 | $16,400 | $79,100 |
| 2020 | $787 | $95,500 | $16,400 | $79,100 |
| 2019 | $851 | $84,400 | $20,300 | $64,100 |
| 2018 | $687 | $76,700 | $17,800 | $58,900 |
| 2017 | $607 | $73,300 | $17,800 | $55,500 |
| 2016 | $597 | $72,800 | $17,800 | $55,000 |
| 2014 | $497 | $66,500 | $17,800 | $48,700 |
Source: Public Records
Map
Nearby Homes
Your Personal Tour Guide
Ask me questions while you tour the home.