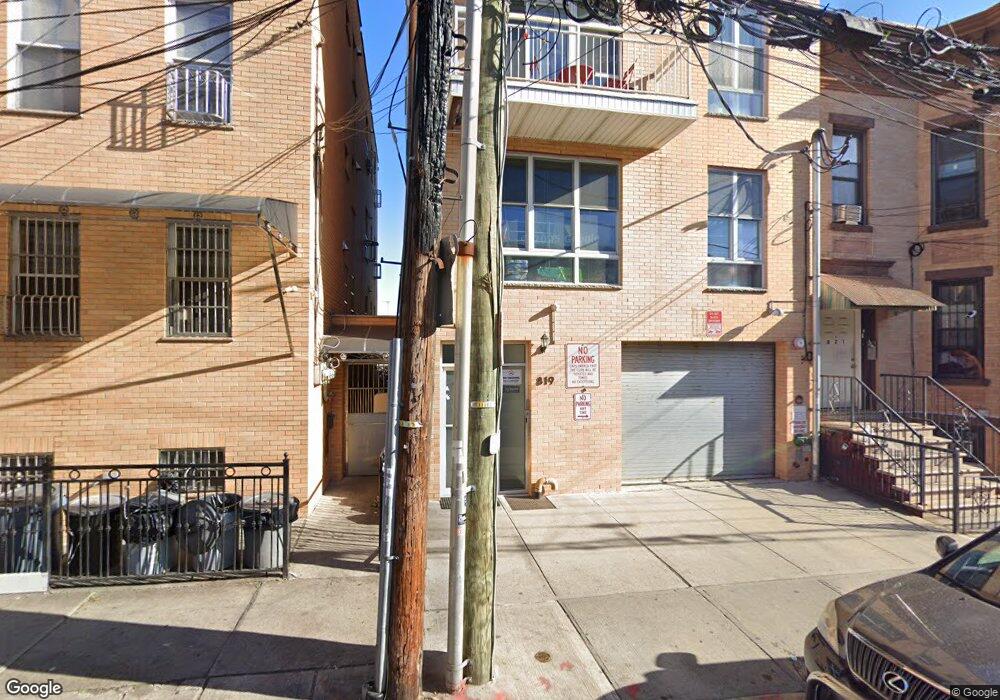
819 41st St Unit 3B Brooklyn, NY 11232
Sunset Park NeighborhoodEstimated Value: $485,000 - $571,000
Studio
--
Bath
576
Sq Ft
$918/Sq Ft
Est. Value
About This Home
This home is located at 819 41st St Unit 3B, Brooklyn, NY 11232 and is currently estimated at $528,634, approximately $917 per square foot. 819 41st St Unit 3B is a home located in Kings County with nearby schools including P.S. 169 Sunset Park, I.S. 223 The Montauk, and Bnos Margulia Viznitz.
Ownership History
Date
Name
Owned For
Owner Type
Purchase Details
Closed on
Mar 9, 2023
Sold by
Wei Rui Ying and Zhong Weibiao
Bought by
Shi Wen Zhong As Trustee and Zhong Family Irrevocable Trust
Current Estimated Value
Purchase Details
Closed on
Oct 4, 2022
Sold by
Zhong Shi Wen
Bought by
Wei Rui Ying and Zhong Weibiao
Purchase Details
Closed on
Sep 10, 2013
Sold by
Liu & Sons Realty Llc
Bought by
Zhong Shi Wen
Home Financials for this Owner
Home Financials are based on the most recent Mortgage that was taken out on this home.
Original Mortgage
$180,000
Interest Rate
4.52%
Mortgage Type
New Conventional
Create a Home Valuation Report for This Property
The Home Valuation Report is an in-depth analysis detailing your home's value as well as a comparison with similar homes in the area
Home Values in the Area
Average Home Value in this Area
Purchase History
We collect this data history from publicly available records. To have your information removed, we recommend requesting removal directly through your county’s website.
| Date | Buyer | Sale Price | Title Company |
|---|---|---|---|
| Shi Wen Zhong As Trustee | $2,800 | -- | |
| Wei Rui Ying | -- | -- | |
| Zhong Shi Wen | $307,242 | -- |
Source: Public Records
Mortgage History
We collect this data history from publicly available records. To have your information removed, we recommend requesting removal directly through your county’s website.
| Date | Status | Borrower | Loan Amount |
|---|---|---|---|
| Previous Owner | Zhong Shi Wen | $180,000 |
Source: Public Records
Tax History
| Year | Tax Paid | Tax Assessment Tax Assessment Total Assessment is a certain percentage of the fair market value that is determined by local assessors to be the total taxable value of land and additions on the property. | Land | Improvement |
|---|---|---|---|---|
| 2026 | $2,006 | $102,434 | $13,401 | $89,033 |
| 2025 | $1,022 | $85,368 | $13,401 | $71,967 |
| 2024 | $1,022 | $71,127 | $13,401 | $57,726 |
| 2023 | $174 | $80,074 | $13,401 | $66,673 |
| 2022 | $173 | $78,700 | $13,401 | $65,299 |
| 2021 | $171 | $64,243 | $13,401 | $50,842 |
| 2020 | $176 | $62,359 | $13,401 | $48,958 |
| 2019 | $178 | $51,984 | $13,401 | $38,583 |
| 2018 | $180 | $27,066 | $8,372 | $18,694 |
| 2017 | $180 | $26,225 | $9,380 | $16,845 |
| 2016 | $183 | $24,283 | $10,853 | $13,430 |
| 2015 | -- | $22,485 | $12,055 | $10,430 |
| 2014 | -- | $20,820 | $13,400 | $7,420 |
Source: Public Records
Map
Nearby Homes
Your Personal Tour Guide
Ask me questions while you tour the home.