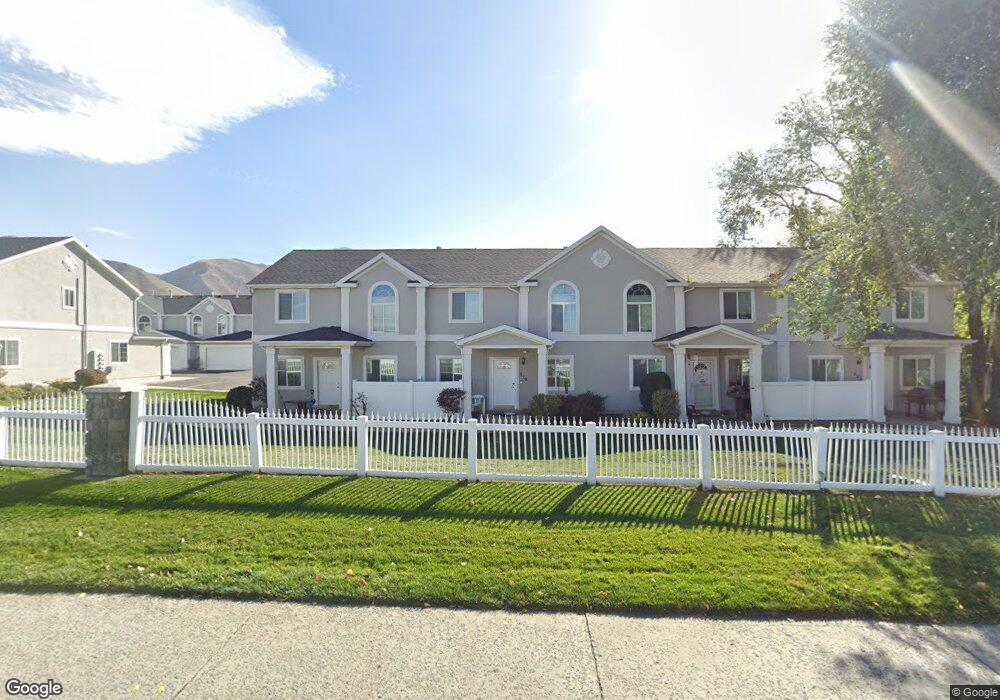
819 Sugar Maple Ct Unit 63 Payson, UT 84651
Estimated Value: $336,367 - $351,000
3
Beds
3
Baths
1,332
Sq Ft
$258/Sq Ft
Est. Value
About This Home
This home is located at 819 Sugar Maple Ct Unit 63, Payson, UT 84651 and is currently estimated at $343,842, approximately $258 per square foot. 819 Sugar Maple Ct Unit 63 is a home located in Utah County with nearby schools including Spring Lake Elementary, Payson Junior High School, and Payson High School.
Ownership History
Date
Name
Owned For
Owner Type
Purchase Details
Closed on
Aug 4, 2016
Sold by
Orton Colten
Bought by
Orton Colten
Current Estimated Value
Home Financials for this Owner
Home Financials are based on the most recent Mortgage that was taken out on this home.
Original Mortgage
$129,000
Outstanding Balance
$57,489
Interest Rate
2.83%
Mortgage Type
New Conventional
Estimated Equity
$286,353
Purchase Details
Closed on
Oct 28, 2014
Sold by
Nebo Cu
Bought by
Orton Colten
Home Financials for this Owner
Home Financials are based on the most recent Mortgage that was taken out on this home.
Original Mortgage
$109,600
Interest Rate
4.2%
Mortgage Type
New Conventional
Purchase Details
Closed on
Aug 19, 2013
Sold by
Sorensen Michael R and Sorensen Alisha A
Bought by
Nebo Credit Union
Purchase Details
Closed on
Aug 9, 2000
Sold by
Country Living Development Inc
Bought by
Guest Matthew C and Guest Teresa
Home Financials for this Owner
Home Financials are based on the most recent Mortgage that was taken out on this home.
Original Mortgage
$116,463
Interest Rate
8.19%
Mortgage Type
FHA
Create a Home Valuation Report for This Property
The Home Valuation Report is an in-depth analysis detailing your home's value as well as a comparison with similar homes in the area
Home Values in the Area
Average Home Value in this Area
Purchase History
We collect this data history from publicly available records. To have your information removed, we recommend requesting removal directly through your county’s website.
| Date | Buyer | Sale Price | Title Company |
|---|---|---|---|
| Orton Colten | -- | Keystone Title Ins Agcy | |
| Orton Colten | -- | Pro Title And Escrow Inc | |
| Nebo Credit Union | $123,000 | None Available | |
| Guest Matthew C | -- | Mountain West Title Co |
Source: Public Records
Mortgage History
We collect this data history from publicly available records. To have your information removed, we recommend requesting removal directly through your county’s website.
| Date | Status | Borrower | Loan Amount |
|---|---|---|---|
| Open | Orton Colten | $129,000 | |
| Previous Owner | Orton Colten | $109,600 | |
| Previous Owner | Guest Matthew C | $116,463 |
Source: Public Records
Tax History
| Year | Tax Paid | Tax Assessment Tax Assessment Total Assessment is a certain percentage of the fair market value that is determined by local assessors to be the total taxable value of land and additions on the property. | Land | Improvement |
|---|---|---|---|---|
| 2025 | $1,721 | $172,535 | -- | -- |
| 2024 | $1,721 | $175,175 | $0 | $0 |
| 2023 | $1,648 | $168,190 | $0 | $0 |
| 2022 | $1,529 | $153,505 | $0 | $0 |
| 2021 | $1,386 | $223,100 | $33,500 | $189,600 |
| 2020 | $1,326 | $208,800 | $31,300 | $177,500 |
| 2019 | $1,189 | $192,000 | $25,000 | $167,000 |
| 2018 | $1,157 | $180,000 | $22,000 | $158,000 |
| 2017 | $999 | $83,600 | $0 | $0 |
| 2016 | $939 | $78,100 | $0 | $0 |
| 2015 | $899 | $74,250 | $0 | $0 |
| 2014 | $815 | $67,815 | $0 | $0 |
Source: Public Records
Map
Nearby Homes
- 802 Sugar Maple Ct
- 1428 S 730 W
- 802 Brookside Ct
- 1463 S 930 W
- 1468 S 910 W
- 1320 S 950 W
- 1529 S 780 W
- 1333 S 1050 W
- 1172 S 880 W
- 799 W 1150 S
- 1403 S 600 W
- 1338 S 1050 W
- 1144 S 780 W
- 2003 S 1150 W Unit 1040
- 1589 S 840 W
- 1146 W 1260 S
- 1136 S Highway 198
- 598 W Saddlebrook Dr
- 1128 W 1150 S Unit 9
- 609 W Saddlebrook Dr
- 815 Sugar Maple Ct Unit 62
- 823 Sugar Maple Ct Unit 64
- 823 Sugar Maple Ct
- 818 Sugar Ct
- 822 Sugar Maple Ct
- 822 Sugar Maple Ct Unit 56
- 818 Sugar Maple Ct Unit 55
- 818 Sugar Maple Ct
- 826 Sugar Maple Ct Unit 57
- 826 Sugar Maple Ct
- 827 Sugar Maple Ct Unit 65
- 827 Sugar Maple Ct
- 814 Sugar Maple Ct Unit 54
- 807 Sugar Maple Ct
- 803 Sugar Maple Ct Unit 60
- 803 Sugar Maple Ct
- 799 Sugar Maple Ct Unit 59
- 799 Sugar Maple Ct
- 822 Big Leaf Ct
- 818 Big Leaf Ct
Your Personal Tour Guide
Ask me questions while you tour the home.