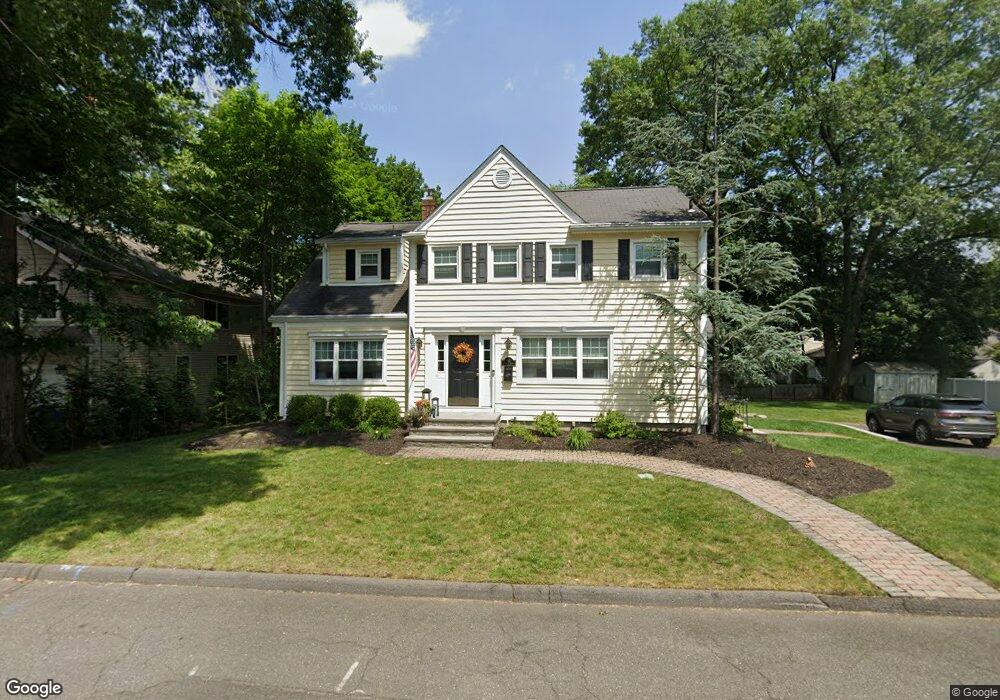
82 7th St Cresskill, NJ 07626
Estimated Value: $785,000 - $931,000
Studio
--
Bath
2,052
Sq Ft
$424/Sq Ft
Est. Value
About This Home
This home is located at 82 7th St, Cresskill, NJ 07626 and is currently estimated at $869,035, approximately $423 per square foot. 82 7th St is a home located in Bergen County with nearby schools including Cresskill High School and Academy of Our Lady of Mount Carmel.
Ownership History
Date
Name
Owned For
Owner Type
Purchase Details
Closed on
Dec 21, 1998
Sold by
Decandia Vincent and Decandia Grace
Bought by
Decandia Victor and Decandia Erin
Current Estimated Value
Home Financials for this Owner
Home Financials are based on the most recent Mortgage that was taken out on this home.
Original Mortgage
$180,000
Interest Rate
4%
Mortgage Type
Seller Take Back
Purchase Details
Closed on
Jan 23, 1997
Sold by
Quinn Florence E
Bought by
Decandia Vincent De and Decandia Grace De
Home Financials for this Owner
Home Financials are based on the most recent Mortgage that was taken out on this home.
Original Mortgage
$140,000
Interest Rate
7.65%
Create a Home Valuation Report for This Property
The Home Valuation Report is an in-depth analysis detailing your home's value as well as a comparison with similar homes in the area
Home Values in the Area
Average Home Value in this Area
Purchase History
| Date | Buyer | Sale Price | Title Company |
|---|---|---|---|
| Decandia Victor | -- | -- | |
| Decandia Vincent De | $190,000 | -- |
Source: Public Records
Mortgage History
| Date | Status | Borrower | Loan Amount |
|---|---|---|---|
| Closed | Decandia Victor | $180,000 | |
| Closed | Decandia Vincent De | $140,000 |
Source: Public Records
Tax History
| Year | Tax Paid | Tax Assessment Tax Assessment Total Assessment is a certain percentage of the fair market value that is determined by local assessors to be the total taxable value of land and additions on the property. | Land | Improvement |
|---|---|---|---|---|
| 2025 | $13,625 | $646,700 | $407,500 | $239,200 |
| 2024 | $12,898 | $592,400 | $362,500 | $229,900 |
| 2023 | $12,069 | $555,700 | $332,500 | $223,200 |
| 2022 | $12,069 | $501,400 | $287,500 | $213,900 |
| 2021 | $11,534 | $472,300 | $265,000 | $207,300 |
| 2020 | $11,146 | $458,300 | $255,000 | $203,300 |
| 2019 | $10,875 | $451,800 | $252,500 | $199,300 |
| 2018 | $7,530 | $446,600 | $250,000 | $196,600 |
| 2017 | $12,113 | $445,000 | $236,300 | $208,700 |
| 2016 | $11,752 | $445,000 | $236,300 | $208,700 |
| 2015 | $11,388 | $445,000 | $236,300 | $208,700 |
| 2014 | $11,045 | $445,000 | $236,300 | $208,700 |
Source: Public Records
Map
Nearby Homes
Your Personal Tour Guide
Ask me questions while you tour the home.