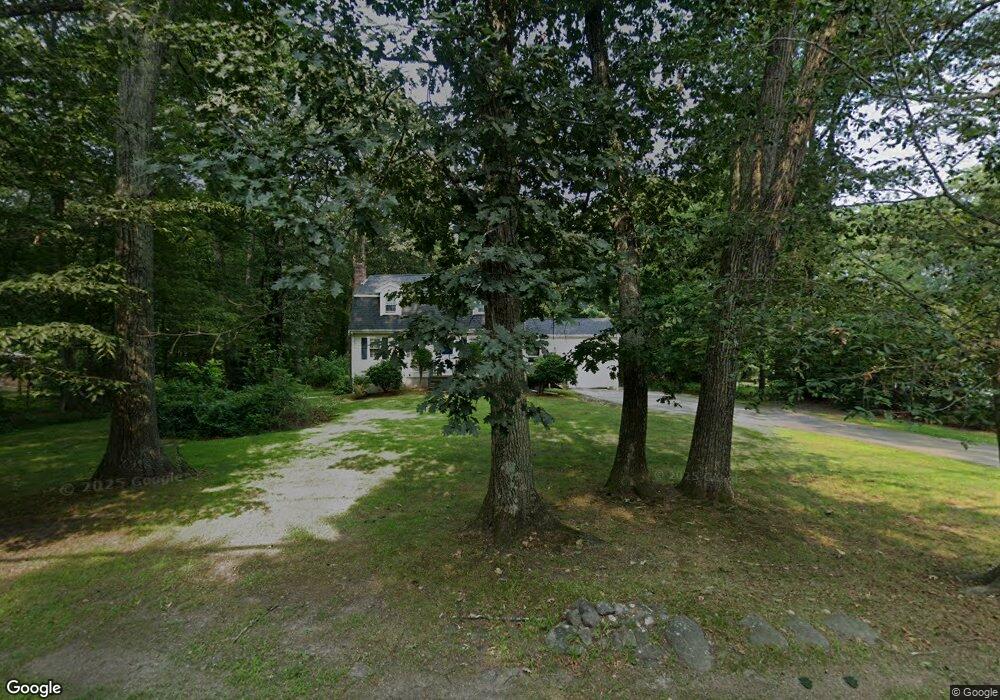
82 Acorn St Millis, MA 02054
Estimated Value: $641,000 - $1,106,000
About This Home
This home is located at 82 Acorn St, Millis, MA 02054 and is currently estimated at $782,883, approximately $447 per square foot. 82 Acorn St is a home located in Norfolk County with nearby schools including Clyde F Brown, Millis Middle School, and Millis High School.
Ownership History
We collect this data history from publicly available records. To have your information removed, we recommend requesting removal directly through your county’s website.
Purchase Details
Purchase Details
Home Financials for this Owner
Home Financials are based on the most recent Mortgage that was taken out on this home.Home Values in the Area
Average Home Value in this Area
Purchase History
We collect this data history from publicly available records. To have your information removed, we recommend requesting removal directly through your county’s website.
| Date | Buyer | Sale Price | Title Company |
|---|---|---|---|
| -- | -- | ||
| $186,500 | -- |
Mortgage History
We collect this data history from publicly available records. To have your information removed, we recommend requesting removal directly through your county’s website.
| Date | Status | Borrower | Loan Amount |
|---|---|---|---|
| Previous Owner | $66,000 |
Tax History
We collect this data history from publicly available records. To have your information removed, we recommend requesting removal directly through your county’s website.
| Year | Tax Paid | Tax Assessment Tax Assessment Total Assessment is a certain percentage of the fair market value that is determined by local assessors to be the total taxable value of land and additions on the property. | Land | Improvement |
|---|---|---|---|---|
| 2025 | $9,492 | $578,800 | $215,900 | $362,900 |
| 2024 | $9,175 | $558,800 | $215,900 | $342,900 |
| 2023 | $9,112 | $521,000 | $187,800 | $333,200 |
| 2022 | $8,198 | $434,200 | $172,900 | $261,300 |
| 2021 | $8,095 | $412,600 | $172,900 | $239,700 |
| 2020 | $7,927 | $393,600 | $161,600 | $232,000 |
| 2019 | $7,084 | $378,800 | $152,500 | $226,300 |
| 2018 | $6,583 | $365,300 | $139,000 | $226,300 |
| 2017 | $6,696 | $363,500 | $155,600 | $207,900 |
| 2016 | $6,339 | $363,500 | $155,600 | $207,900 |
| 2015 | $5,777 | $339,800 | $150,800 | $189,000 |
Map
- 51 Spencer St Unit 1
- 234-236-0 Pleasant St
- 186 Pleasant St
- 37 Rockville Meadows
- 203 Pleasant St
- 8 Castle Rd
- 3 Pine Ridge Dr Unit 1
- 33 Myrtle St
- 488R Main St
- 1280 Main St
- 5 Bayberry Cir
- 17 April Way
- 24 Vernon Rd
- 16 Westfield Dr
- 324 Union St Unit 1
- 37 North St
- 64 Village St
- 60 Hilltop Dr
- 19 Barber St Unit B
- 118 Village St Unit A
Ask me questions while you tour the home.