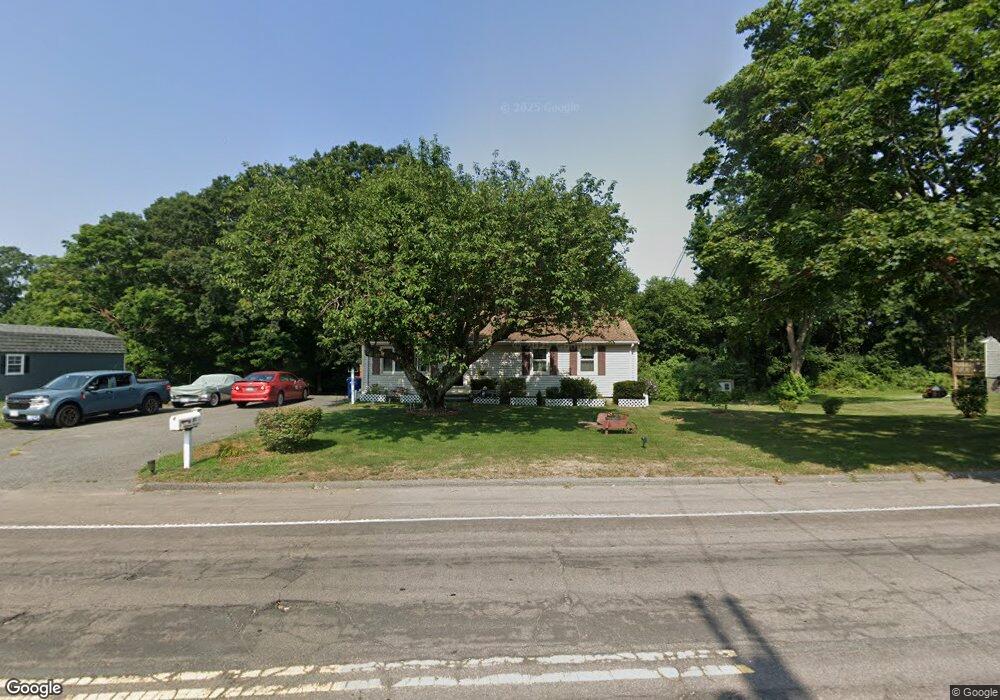
82 Anthony St Seekonk, MA 02771
Monroes-South Seekonk NeighborhoodEstimated Value: $445,000 - $490,000
3
Beds
2
Baths
1,056
Sq Ft
$449/Sq Ft
Est. Value
About This Home
This home is located at 82 Anthony St, Seekonk, MA 02771 and is currently estimated at $474,266, approximately $449 per square foot. 82 Anthony St is a home located in Bristol County with nearby schools including Seekonk High School, St Mary Academy-Bay View, and Providence Country Day School.
Ownership History
Date
Name
Owned For
Owner Type
Purchase Details
Closed on
Dec 21, 2011
Sold by
Ingala Joyce E
Bought by
Ir Joyce E Ingala-Cole and Ingala Jeffrey R
Current Estimated Value
Purchase Details
Closed on
Dec 13, 1996
Sold by
Ingala John and Ingala John E
Bought by
Ingala Joyce E
Home Financials for this Owner
Home Financials are based on the most recent Mortgage that was taken out on this home.
Original Mortgage
$40,000
Interest Rate
7.75%
Mortgage Type
Purchase Money Mortgage
Create a Home Valuation Report for This Property
The Home Valuation Report is an in-depth analysis detailing your home's value as well as a comparison with similar homes in the area
Home Values in the Area
Average Home Value in this Area
Purchase History
We collect this data history from publicly available records. To have your information removed, we recommend requesting removal directly through your county’s website.
| Date | Buyer | Sale Price | Title Company |
|---|---|---|---|
| Ir Joyce E Ingala-Cole | -- | -- | |
| Ingala Joyce E | $10,000 | -- |
Source: Public Records
Mortgage History
We collect this data history from publicly available records. To have your information removed, we recommend requesting removal directly through your county’s website.
| Date | Status | Borrower | Loan Amount |
|---|---|---|---|
| Previous Owner | Ingala Joyce E | $47,500 | |
| Previous Owner | Ingala Joyce E | $12,000 | |
| Previous Owner | Ingala Joyce E | $40,000 |
Source: Public Records
Tax History
| Year | Tax Paid | Tax Assessment Tax Assessment Total Assessment is a certain percentage of the fair market value that is determined by local assessors to be the total taxable value of land and additions on the property. | Land | Improvement |
|---|---|---|---|---|
| 2025 | $4,634 | $375,200 | $167,400 | $207,800 |
| 2024 | $4,472 | $362,100 | $167,400 | $194,700 |
| 2023 | $4,052 | $309,100 | $142,600 | $166,500 |
| 2022 | $3,718 | $278,700 | $136,500 | $142,200 |
| 2021 | $3,519 | $259,300 | $120,000 | $139,300 |
| 2020 | $3,286 | $249,500 | $120,200 | $129,300 |
| 2019 | $3,130 | $239,700 | $114,600 | $125,100 |
| 2018 | $3,077 | $230,500 | $111,400 | $119,100 |
| 2017 | $3,050 | $226,600 | $108,700 | $117,900 |
| 2016 | $2,974 | $221,800 | $108,700 | $113,100 |
| 2015 | $2,911 | $220,000 | $108,700 | $111,300 |
Source: Public Records
Map
Nearby Homes
Your Personal Tour Guide
Ask me questions while you tour the home.