
Seller's Agent in 2025
Eric Whelan
Leverage Real Estate Group
(978) 340-4541
1 in this area
4 Total Sales


Estimated Value: $501,000 - $515,000
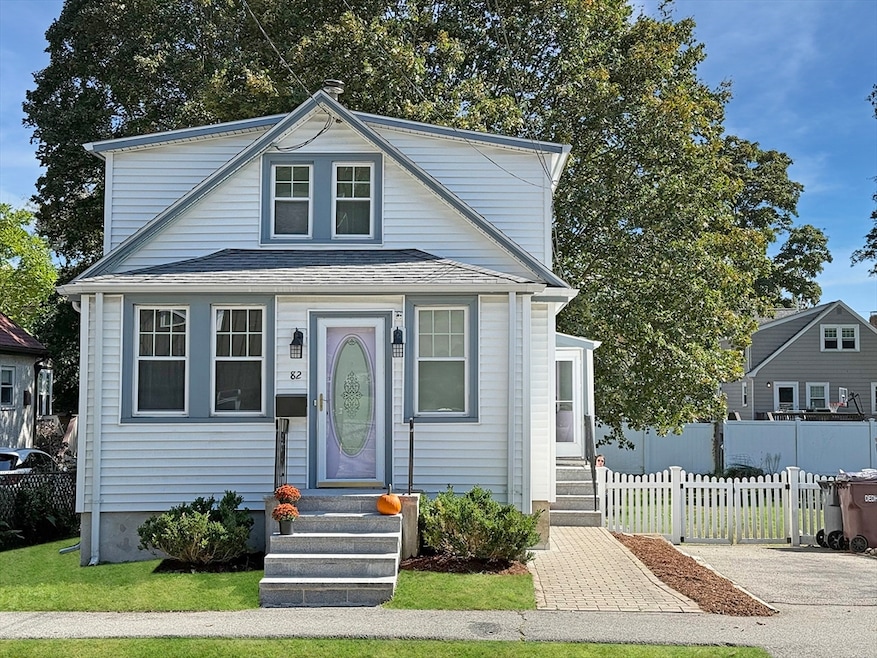
OFFER DEADLINE BELOW. Welcome HOME to 82 Bonham. This single-family residence presents a unique opportunity to feel the history of Dedham while enjoying the modern neighborhood amenities, and LOCATION. Ideally situated between I95 & Readville Station, this 2 bedroom home provides separate sleeping retreats for rest and rejuvenating while the main floor invites calm entertaining with it's cozy living room, dining room and kitchen layout. The 949 square feet of living area provides an intimate and manageable space for daily life. The generous 10,000 square foot lot presents a opportunity to enjoy outdoor activities like gardening and entertaining or just simply basking in the open air. Built in 1910, this home carries a sense of history and invites you to become its next chapter.
| Date | Buyer | Sale Price | Title Company |
|---|---|---|---|
| Howdy Annemarie C | -- | -- | |
| Howdy Richard | $510,000 | -- | |
| Powell Margaret A | $123,000 | -- |
| Date | Status | Borrower | Loan Amount |
|---|---|---|---|
| Previous Owner | Powell Margaret A | $115,280 | |
| Previous Owner | Powell Margaret A | $124,508 | |
| Previous Owner | Powell Margaret A | $124,196 |
| Date | Event | Price | List to Sale | Price per Sq Ft |
|---|---|---|---|---|
| 10/27/2025 10/27/25 | Sold | $510,000 | +7.4% | $537 / Sq Ft |
| 10/08/2025 10/08/25 | Pending | -- | -- | -- |
| 09/29/2025 09/29/25 | For Sale | $475,000 | -- | $501 / Sq Ft |
| Year | Tax Paid | Tax Assessment Tax Assessment Total Assessment is a certain percentage of the fair market value that is determined by local assessors to be the total taxable value of land and additions on the property. | Land | Improvement |
|---|---|---|---|---|
| 2025 | $6,527 | $517,200 | $344,500 | $172,700 |
| 2024 | $5,905 | $472,400 | $312,500 | $159,900 |
| 2023 | $5,746 | $447,500 | $283,000 | $164,500 |
| 2022 | $5,460 | $409,000 | $265,800 | $143,200 |
| 2021 | $5,033 | $368,200 | $246,100 | $122,100 |
| 2020 | $5,049 | $368,000 | $246,100 | $121,900 |
| 2019 | $4,713 | $333,100 | $214,000 | $119,100 |
| 2018 | $4,508 | $309,800 | $187,000 | $122,800 |
| 2017 | $4,314 | $292,300 | $175,000 | $117,300 |
| 2016 | $4,156 | $268,300 | $162,000 | $106,300 |
| 2015 | $4,404 | $277,500 | $161,700 | $115,800 |
| 2014 | $4,287 | $266,600 | $158,800 | $107,800 |
Seller's Agent in 2025
Eric Whelan
Leverage Real Estate Group
(978) 340-4541
1 in this area
4 Total Sales
Buyer's Agent in 2025
Ron Resha
Coldwell Banker Realty - Canton
(781) 752-6111
5 in this area
58 Total Sales
Source: MLS Property Information Network (MLS PIN)
MLS Number: 73436961
APN: DEDH-000170-000000-000166
Disclaimer: Certain information contained herein is derived from information provided by parties other than Homes.com. All information provided is deemed reliable, but is not guaranteed to be accurate and should be independently verified.
![]() The property listing data and information, or the Images, set forth herein were provided to MLS Property Information Network, Inc. from third party sources, including sellers, lessors and public records, and were compiled by MLS Property Information Network, Inc. The property listing data and information, and the Images, are for the personal, non-commercial use of consumers having a good faith interest in purchasing or leasing listed properties of the type displayed to them and may not be used for any purpose other than to identify prospective properties which such consumers may have a good faith interest in purchasing or leasing. MLS Property Information Network, Inc. and its subscribers disclaim any and all representations and warranties as to the accuracy of the property listing data and information, or as to the accuracy of any of the Images, set forth herein.
The property listing data and information, or the Images, set forth herein were provided to MLS Property Information Network, Inc. from third party sources, including sellers, lessors and public records, and were compiled by MLS Property Information Network, Inc. The property listing data and information, and the Images, are for the personal, non-commercial use of consumers having a good faith interest in purchasing or leasing listed properties of the type displayed to them and may not be used for any purpose other than to identify prospective properties which such consumers may have a good faith interest in purchasing or leasing. MLS Property Information Network, Inc. and its subscribers disclaim any and all representations and warranties as to the accuracy of the property listing data and information, or as to the accuracy of any of the Images, set forth herein.
Ask me questions while you tour the home.