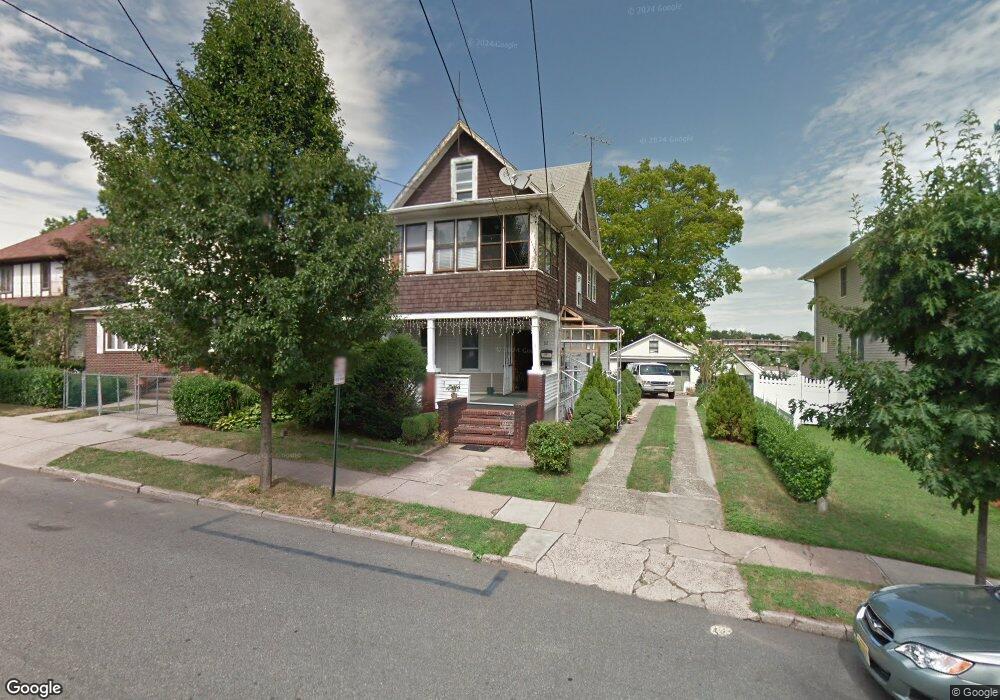
82 Cedar St Garfield, NJ 07026
Estimated Value: $683,331 - $775,000
Studio
--
Bath
2,018
Sq Ft
$365/Sq Ft
Est. Value
About This Home
This home is located at 82 Cedar St, Garfield, NJ 07026 and is currently estimated at $737,083, approximately $365 per square foot. 82 Cedar St is a home located in Bergen County with nearby schools including Garfield High School, Bergen Arts and Sciences Charter School, and Passaic Catholic Regional School.
Ownership History
Date
Name
Owned For
Owner Type
Purchase Details
Closed on
Jun 22, 2015
Sold by
Michalowski Bohdan
Bought by
Walsh Douglas M
Current Estimated Value
Purchase Details
Closed on
Nov 8, 2001
Sold by
Ochab Eddward
Bought by
Michalowski Bohdan
Home Financials for this Owner
Home Financials are based on the most recent Mortgage that was taken out on this home.
Original Mortgage
$130,000
Interest Rate
6.7%
Create a Home Valuation Report for This Property
The Home Valuation Report is an in-depth analysis detailing your home's value as well as a comparison with similar homes in the area
Home Values in the Area
Average Home Value in this Area
Purchase History
We collect this data history from publicly available records. To have your information removed, we recommend requesting removal directly through your county’s website.
| Date | Buyer | Sale Price | Title Company |
|---|---|---|---|
| Walsh Douglas M | $405,000 | Old Republic National Title | |
| Michalowski Bohdan | $236,500 | -- |
Source: Public Records
Mortgage History
We collect this data history from publicly available records. To have your information removed, we recommend requesting removal directly through your county’s website.
| Date | Status | Borrower | Loan Amount |
|---|---|---|---|
| Previous Owner | Michalowski Bohdan | $130,000 |
Source: Public Records
Tax History
| Year | Tax Paid | Tax Assessment Tax Assessment Total Assessment is a certain percentage of the fair market value that is determined by local assessors to be the total taxable value of land and additions on the property. | Land | Improvement |
|---|---|---|---|---|
| 2025 | $11,209 | $335,900 | $136,300 | $199,600 |
| 2024 | $11,021 | $335,900 | $136,300 | $199,600 |
| 2023 | $10,477 | $335,900 | $136,300 | $199,600 |
| 2022 | $10,477 | $335,900 | $136,300 | $199,600 |
| 2021 | $10,171 | $335,900 | $136,300 | $199,600 |
| 2020 | $9,949 | $335,900 | $136,300 | $199,600 |
| 2019 | $9,761 | $335,900 | $136,300 | $199,600 |
| 2018 | $9,543 | $335,900 | $136,300 | $199,600 |
| 2017 | $9,375 | $335,900 | $136,300 | $199,600 |
| 2016 | $9,096 | $335,900 | $136,300 | $199,600 |
| 2015 | $8,871 | $318,300 | $136,300 | $182,000 |
| 2014 | -- | $318,300 | $136,300 | $182,000 |
Source: Public Records
Map
Nearby Homes
- 122 Cedar St
- 107 Summit Ave
- 0 Passaic Unit 26009533
- 164 Chestnut St
- 158 Pierre Ave
- 43 Maitland Place
- 264 Lincoln Place
- 270 Midland Ave
- 229 Palisade Ave
- 77 Morrell Place
- 19 Cherry St
- 10 Irving Place
- 10 Maple St
- 67 Grand St
- 56 Malcolm Ave
- 60 Dewitt St Unit A
- 60 Dewitt St
- 165 Macarthur Ave
- 163 Macarthur Ave
- 319 Outwater Ln
- 94 Cedar St Unit 2
- 90 Cedar St
- 102 Cedar St Unit 2
- 102 Cedar St
- 86 Cedar St Unit 1
- 86 Cedar St
- 91 Chestnut St
- 91 Chestnut St Unit 2ND FL
- 95 Chestnut St
- 95 Chestnut St Unit 2
- 106 Cedar St
- 87 Chestnut St
- 63 Cedar St
- 101 Chestnut St
- 85 Chestnut St
- 99 Chestnut St
- 93 Cedar St
- 110 Cedar St
- 81 Chestnut St
- 105 Chestnut St
Your Personal Tour Guide
Ask me questions while you tour the home.