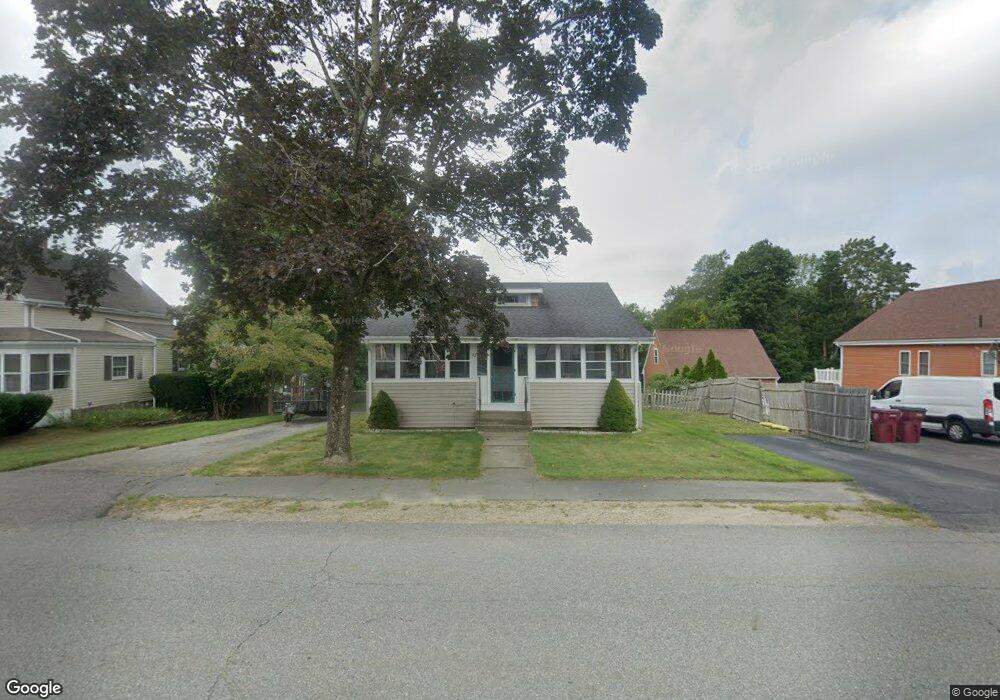
82 Everett St Middleboro, MA 02346
Estimated Value: $440,000 - $472,389
2
Beds
1
Bath
1,210
Sq Ft
$378/Sq Ft
Est. Value
About This Home
This home is located at 82 Everett St, Middleboro, MA 02346 and is currently estimated at $457,347, approximately $377 per square foot. 82 Everett St is a home located in Plymouth County with nearby schools including Mary K. Goode Elementary School and Mullein Hill Christian Academy.
Ownership History
Date
Name
Owned For
Owner Type
Purchase Details
Closed on
Aug 13, 1999
Sold by
Fhlmc
Bought by
Gidley Robert M and Gidley Kathleen M
Current Estimated Value
Purchase Details
Closed on
Aug 5, 1999
Sold by
Mcalavy Bryan R and First Nationwide Mtg
Bought by
Fhlmc
Purchase Details
Closed on
Sep 29, 1989
Sold by
Robinson David
Bought by
Mcalavy Bryan R
Purchase Details
Closed on
May 1, 1987
Sold by
Benson G C By Admrx
Bought by
Robinson David
Create a Home Valuation Report for This Property
The Home Valuation Report is an in-depth analysis detailing your home's value as well as a comparison with similar homes in the area
Home Values in the Area
Average Home Value in this Area
Purchase History
| Date | Buyer | Sale Price | Title Company |
|---|---|---|---|
| Gidley Robert M | $119,400 | -- | |
| Fhlmc | $116,100 | -- | |
| Mcalavy Bryan R | $129,900 | -- | |
| Gidley Robert M | $119,400 | -- | |
| Fhlmc | $116,100 | -- | |
| Mcalavy Bryan R | $129,900 | -- | |
| Robinson David | $87,400 | -- |
Source: Public Records
Mortgage History
| Date | Status | Borrower | Loan Amount |
|---|---|---|---|
| Open | Robinson David | $50,000 | |
| Closed | Robinson David | $28,436 |
Source: Public Records
Tax History
| Year | Tax Paid | Tax Assessment Tax Assessment Total Assessment is a certain percentage of the fair market value that is determined by local assessors to be the total taxable value of land and additions on the property. | Land | Improvement |
|---|---|---|---|---|
| 2025 | $5,521 | $411,700 | $166,700 | $245,000 |
| 2024 | $4,322 | $319,200 | $158,700 | $160,500 |
| 2023 | $4,390 | $308,300 | $158,700 | $149,600 |
| 2022 | $4,208 | $273,600 | $138,000 | $135,600 |
| 2021 | $4,027 | $247,500 | $121,100 | $126,400 |
| 2020 | $3,949 | $248,700 | $121,100 | $127,600 |
| 2019 | $3,629 | $234,400 | $121,100 | $113,300 |
| 2018 | $3,310 | $212,200 | $115,300 | $96,900 |
| 2017 | $3,173 | $201,200 | $110,900 | $90,300 |
| 2016 | $3,143 | $197,400 | $101,400 | $96,000 |
| 2015 | $3,091 | $195,900 | $101,400 | $94,500 |
Source: Public Records
Map
Nearby Homes
Your Personal Tour Guide
Ask me questions while you tour the home.