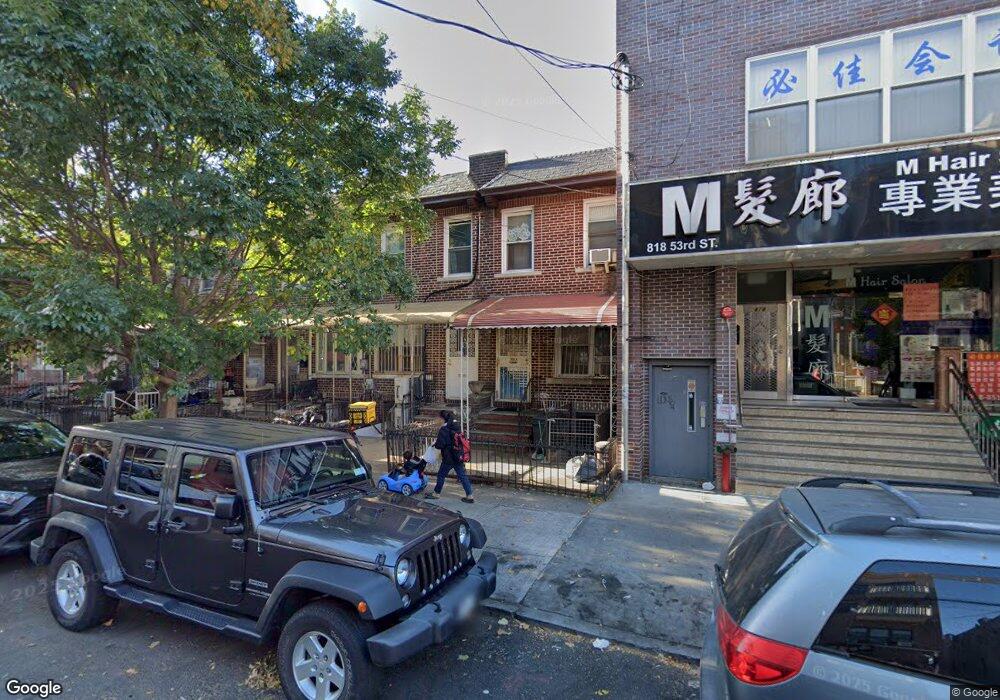
822 53rd St Brooklyn, NY 11220
Sunset Park NeighborhoodEstimated Value: $956,000 - $1,119,000
About This Home
This home is located at 822 53rd St, Brooklyn, NY 11220 and is currently estimated at $1,032,575, approximately $1,168 per square foot. 822 53rd St is a home located in Kings County with nearby schools including P.S. 160 William T Sampson School, IS 220 John J. Pershing, and Franklin Delano Roosevelt High School.
Ownership History
We collect this data history from publicly available records. To have your information removed, we recommend requesting removal directly through your county’s website.
Purchase Details
Home Financials for this Owner
Home Financials are based on the most recent Mortgage that was taken out on this home.Purchase Details
Purchase Details
Home Values in the Area
Average Home Value in this Area
Purchase History
We collect this data history from publicly available records. To have your information removed, we recommend requesting removal directly through your county’s website.
| Date | Buyer | Sale Price | Title Company |
|---|---|---|---|
| $950,000 | -- | ||
| $950,000 | -- | ||
| $830,000 | -- | ||
| $830,000 | -- | ||
| $830,000 | -- | ||
| -- | -- | ||
| -- | -- |
Mortgage History
We collect this data history from publicly available records. To have your information removed, we recommend requesting removal directly through your county’s website.
| Date | Status | Borrower | Loan Amount |
|---|---|---|---|
| Open | $712,500 | ||
| Closed | $712,500 |
Tax History
We collect this data history from publicly available records. To have your information removed, we recommend requesting removal directly through your county’s website.
| Year | Tax Paid | Tax Assessment Tax Assessment Total Assessment is a certain percentage of the fair market value that is determined by local assessors to be the total taxable value of land and additions on the property. | Land | Improvement |
|---|---|---|---|---|
| 2026 | $6,585 | $62,340 | $13,920 | $48,420 |
| 2025 | $6,217 | $61,680 | $13,920 | $47,760 |
| 2024 | $6,217 | $55,860 | $13,920 | $41,940 |
| 2023 | $5,938 | $49,080 | $13,920 | $35,160 |
| 2022 | $5,837 | $49,860 | $13,920 | $35,940 |
| 2021 | $6,092 | $54,780 | $13,920 | $40,860 |
| 2020 | $2,858 | $51,660 | $13,920 | $37,740 |
| 2019 | $5,396 | $57,120 | $13,920 | $43,200 |
| 2018 | $4,967 | $24,364 | $6,280 | $18,084 |
| 2017 | $4,967 | $24,364 | $6,266 | $18,098 |
| 2016 | $4,823 | $24,124 | $7,120 | $17,004 |
| 2015 | $2,772 | $22,767 | $8,927 | $13,840 |
| 2014 | $2,772 | $21,496 | $9,595 | $11,901 |
Map
- 829 54th St
- 829 54th St Unit 833
- 829 54th St
- 829 54th St
- 827 54th St
- 827 54th St Unit 3F
- 827 54th St Unit 2R
- 827 54th St Unit 2F
- 827 54th St Unit 4R
- 827 54th St Unit 4F
- 827 54th St Unit 3R
- 833 54th St
- 825 54th St
- 841 54th St
- 839 54th St
- 821 54th St
- 843 54th St Unit 5D
- 843 54th St Unit 5C
- 843 54th St Unit 5A
- 843 54th St Unit 4D
Ask me questions while you tour the home.