Estimated Value: $107,000 - $123,000
1
Bed
1
Bath
864
Sq Ft
$133/Sq Ft
Est. Value
About This Home
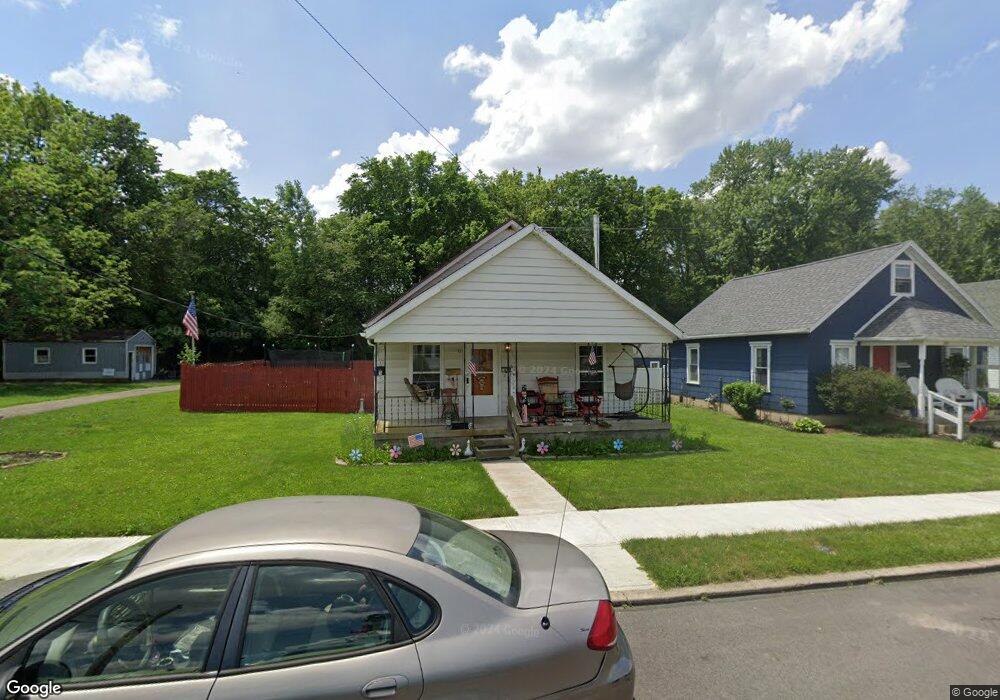
This home is located at 822 Race Dr, Troy, OH 45373 and is currently estimated at $114,703, approximately $132 per square foot. 822 Race Dr is a home located in Miami County with nearby schools including Forest Elementary School, Van Cleve Elementary School, and Troy Junior High School.
Ownership History
Date
Name
Owned For
Owner Type
Purchase Details
Closed on
Mar 1, 2016
Sold by
Rogers Margaret A
Bought by
Reynolds Loretta Lynn
Current Estimated Value
Home Financials for this Owner
Home Financials are based on the most recent Mortgage that was taken out on this home.
Original Mortgage
$48,300
Outstanding Balance
$18,646
Interest Rate
3.1%
Mortgage Type
Seller Take Back
Estimated Equity
$96,057
Purchase Details
Closed on
Jan 31, 2011
Sold by
Sharits Anita
Bought by
Rogers Margaret A
Purchase Details
Closed on
Jan 1, 1990
Bought by
Sharits John B
Create a Home Valuation Report for This Property
The Home Valuation Report is an in-depth analysis detailing your home's value as well as a comparison with similar homes in the area
Home Values in the Area
Average Home Value in this Area
Purchase History
| Date | Buyer | Sale Price | Title Company |
|---|---|---|---|
| Reynolds Loretta Lynn | $48,800 | Attorney | |
| Rogers Margaret A | $47,900 | -- | |
| Sharits John B | -- | -- |
Source: Public Records
Mortgage History
| Date | Status | Borrower | Loan Amount |
|---|---|---|---|
| Open | Reynolds Loretta Lynn | $48,300 |
Source: Public Records
Tax History
| Year | Tax Paid | Tax Assessment Tax Assessment Total Assessment is a certain percentage of the fair market value that is determined by local assessors to be the total taxable value of land and additions on the property. | Land | Improvement |
|---|---|---|---|---|
| 2025 | $1,382 | $33,780 | $7,000 | $26,780 |
| 2024 | $1,382 | $24,710 | $7,280 | $17,430 |
| 2023 | $1,146 | $24,710 | $7,280 | $17,430 |
| 2022 | $895 | $24,710 | $7,280 | $17,430 |
| 2021 | $768 | $19,740 | $5,810 | $13,930 |
| 2020 | $769 | $19,740 | $5,810 | $13,930 |
| 2019 | $776 | $19,740 | $5,810 | $13,930 |
| 2018 | $729 | $17,680 | $6,270 | $11,410 |
| 2017 | $736 | $17,680 | $6,270 | $11,410 |
| 2016 | $727 | $17,680 | $6,270 | $11,410 |
| 2015 | $706 | $16,380 | $5,810 | $10,570 |
| 2014 | $706 | $16,380 | $5,810 | $10,570 |
| 2013 | $710 | $16,380 | $5,810 | $10,570 |
Source: Public Records
Map
Nearby Homes
- 424 S Counts St
- 119 Morehead St
- 996 Stony Brook Ln
- 619 E Canal St
- 712 S Clay St
- 436 S Clay St
- 1003 S Mulberry St
- 103 S Crawford St
- 431 S Walnut St
- 1020 S Market St
- 504 S Market St
- 118 S Walnut St
- 67 W Dakota St
- 408 S Market St
- 517 S Cherry St
- 28 Vincent Ave
- 28 W Canal St
- 216 S Short St
- 0 St Rt 718 Unit Lot 1
- 0 St Rt 718 Unit Lot 2
Your Personal Tour Guide
Ask me questions while you tour the home.