Estimated Value: $709,748 - $1,053,000
About This Home
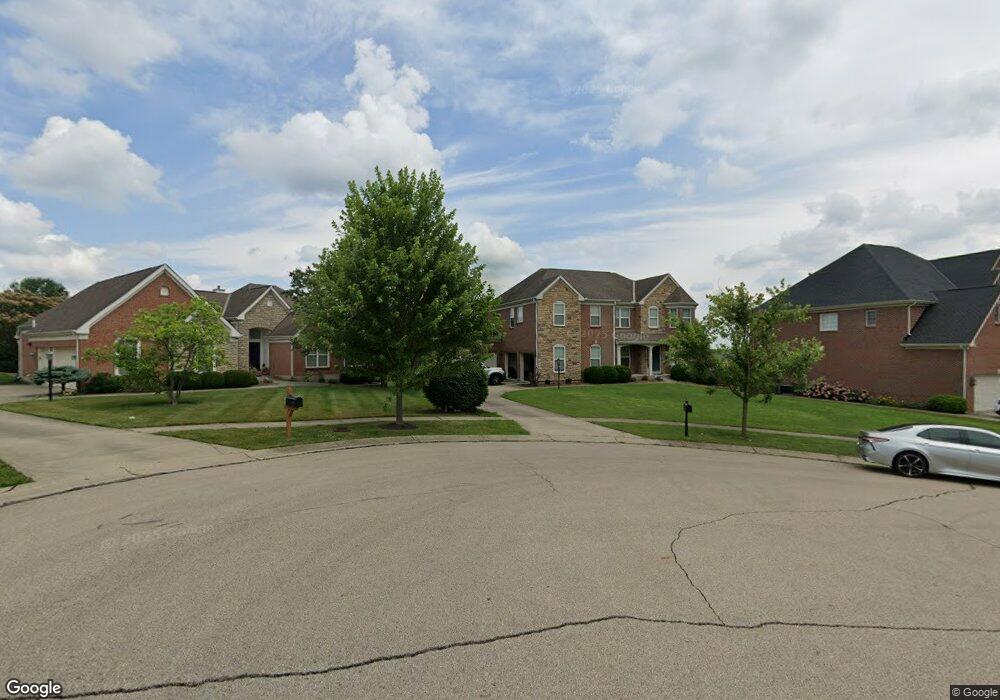
This home is located at 8222 Pineleigh Ct, Mason, OH 45040 and is currently estimated at $851,937, approximately $279 per square foot. 8222 Pineleigh Ct is a home located in Warren County with nearby schools including Mason Intermediate Elementary School, Mason Middle School, and William Mason High School.
Ownership History
We collect this data history from publicly available records. To have your information removed, we recommend requesting removal directly through your county’s website.
Purchase Details
Home Financials for this Owner
Home Financials are based on the most recent Mortgage that was taken out on this home.Purchase Details
Home Values in the Area
Average Home Value in this Area
Purchase History
We collect this data history from publicly available records. To have your information removed, we recommend requesting removal directly through your county’s website.
| Date | Buyer | Sale Price | Title Company |
|---|---|---|---|
| -- | Classic Title | ||
| $78,100 | None Available |
Mortgage History
We collect this data history from publicly available records. To have your information removed, we recommend requesting removal directly through your county’s website.
| Date | Status | Borrower | Loan Amount |
|---|---|---|---|
| Open | $367,600 |
Tax History
We collect this data history from publicly available records. To have your information removed, we recommend requesting removal directly through your county’s website.
| Year | Tax Paid | Tax Assessment Tax Assessment Total Assessment is a certain percentage of the fair market value that is determined by local assessors to be the total taxable value of land and additions on the property. | Land | Improvement |
|---|---|---|---|---|
| 2025 | $8,543 | $198,670 | $45,500 | $153,170 |
| 2024 | $8,543 | $198,670 | $45,500 | $153,170 |
| 2023 | $7,734 | $148,074 | $26,950 | $121,124 |
| 2022 | $7,601 | $148,075 | $26,950 | $121,125 |
| 2021 | $7,233 | $148,075 | $26,950 | $121,125 |
| 2020 | $7,736 | $134,614 | $24,500 | $110,114 |
| 2019 | $7,172 | $134,614 | $24,500 | $110,114 |
| 2018 | $7,108 | $134,614 | $24,500 | $110,114 |
| 2017 | $7,549 | $130,253 | $25,106 | $105,147 |
| 2016 | $7,758 | $130,253 | $25,106 | $105,147 |
| 2015 | $7,172 | $130,253 | $25,106 | $105,147 |
| 2014 | $7,172 | $112,290 | $21,640 | $90,640 |
| 2013 | $7,187 | $127,100 | $24,500 | $102,600 |
Map
- 5625 Baywatch Way
- 5625 Baywatch Way Unit 204
- 8300 Cherrydale Ct
- 5655 Harbourside Dr
- 8017 Birchwood Ct
- 8678 Hampton Bay Place
- 7648 Waterfront Way
- 5576 Winding Cape Way
- 7601 Waterfront Way
- 7511 Somerset Rd
- 7879 Yellowwood Dr
- 9024 Beacon St
- 9071 Quincy Ct
- 6552 Falling Leaves Ct
- 7705 Hunters Trail
- 9285 Leland Ct
- 9045 Fields Dr
- 6591 Falling Leaves Ct
- 7665 Hunt Club Dr
- 5686 Farm Field Dr
- 8226 Pineleigh Ct
- 8218 Pineleigh Ct
- 8377 Ashmont Way
- 8214 Pineleigh Ct
- 8373 Ashmont Way
- 8381 Ashmont Way
- 8230 Pineleigh Ct
- 8223 Pineleigh Ct
- 8369 Ashmont Way
- 8219 Pineleigh Ct
- 8215 Pineleigh Ct
- A Socialville-Fosters Rd
- 8227 Pineleigh Ct
- 8365 Ashmont Way
- 8374 Ashmont Way
- 8237 Cherrydale Ct
- 8370 Ashmont Way
- 8361 Ashmont Way
- 8375 Ashmont Way
- 5597 Baywatch Way
Ask me questions while you tour the home.