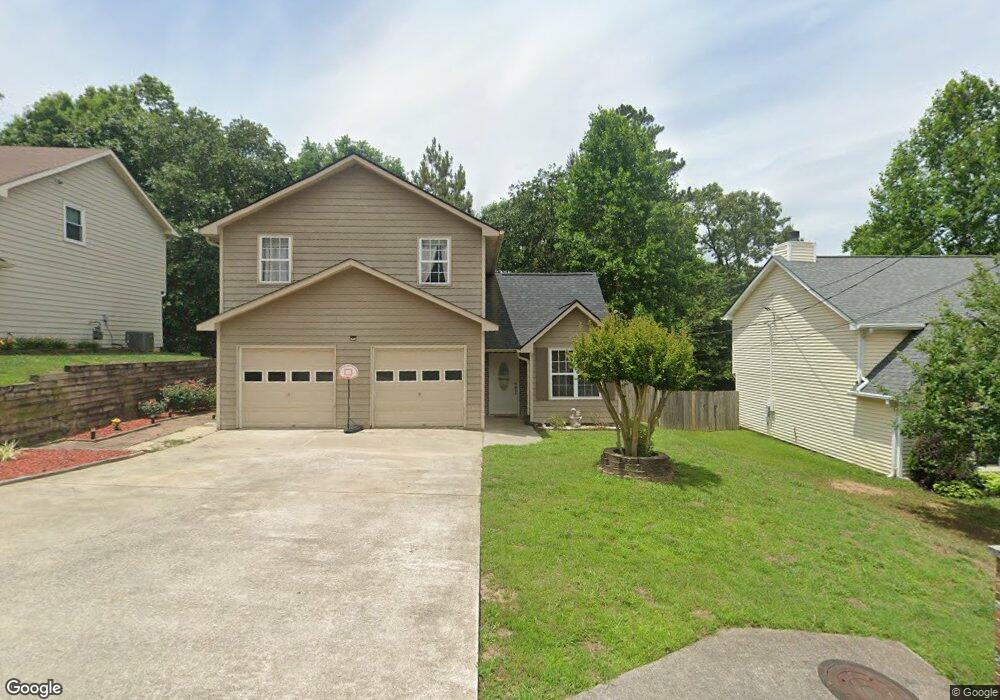
826 Overlook Trail Unit 3 Canton, GA 30115
Estimated Value: $315,993 - $324,000
2
Beds
3
Baths
1,439
Sq Ft
$222/Sq Ft
Est. Value
About This Home
This home is located at 826 Overlook Trail Unit 3, Canton, GA 30115 and is currently estimated at $319,997, approximately $222 per square foot. 826 Overlook Trail Unit 3 is a home located in Cherokee County with nearby schools including Indian Knoll Elementary School, Rusk Middle School, and Sequoyah High School.
Ownership History
Date
Name
Owned For
Owner Type
Purchase Details
Closed on
Apr 4, 2017
Sold by
Kinsey Clifton
Bought by
Munoz Maria
Current Estimated Value
Home Financials for this Owner
Home Financials are based on the most recent Mortgage that was taken out on this home.
Original Mortgage
$142,274
Outstanding Balance
$116,284
Interest Rate
3.75%
Mortgage Type
FHA
Estimated Equity
$203,713
Purchase Details
Closed on
Dec 2, 2002
Sold by
Owen Adam T
Bought by
Kinsey Clifton
Home Financials for this Owner
Home Financials are based on the most recent Mortgage that was taken out on this home.
Original Mortgage
$96,000
Interest Rate
6.3%
Mortgage Type
New Conventional
Purchase Details
Closed on
Jan 7, 2000
Sold by
Chastain Rick
Bought by
Owen Adam T
Home Financials for this Owner
Home Financials are based on the most recent Mortgage that was taken out on this home.
Original Mortgage
$88,497
Interest Rate
7.87%
Mortgage Type
FHA
Create a Home Valuation Report for This Property
The Home Valuation Report is an in-depth analysis detailing your home's value as well as a comparison with similar homes in the area
Home Values in the Area
Average Home Value in this Area
Purchase History
| Date | Buyer | Sale Price | Title Company |
|---|---|---|---|
| Munoz Maria | $144,900 | -- | |
| Kinsey Clifton | $120,000 | -- | |
| Owen Adam T | $92,100 | -- |
Source: Public Records
Mortgage History
| Date | Status | Borrower | Loan Amount |
|---|---|---|---|
| Open | Munoz Maria | $142,274 | |
| Previous Owner | Kinsey Clifton | $96,000 | |
| Previous Owner | Owen Adam T | $88,497 |
Source: Public Records
Tax History
| Year | Tax Paid | Tax Assessment Tax Assessment Total Assessment is a certain percentage of the fair market value that is determined by local assessors to be the total taxable value of land and additions on the property. | Land | Improvement |
|---|---|---|---|---|
| 2025 | $3,340 | $116,088 | $26,000 | $90,088 |
| 2024 | $3,201 | $111,840 | $24,400 | $87,440 |
| 2023 | $3,430 | $119,828 | $24,400 | $95,428 |
| 2022 | $2,588 | $90,176 | $19,200 | $70,976 |
| 2021 | $2,169 | $71,124 | $14,400 | $56,724 |
| 2020 | $1,885 | $61,752 | $12,800 | $48,952 |
| 2019 | $1,808 | $59,200 | $12,800 | $46,400 |
| 2018 | $1,604 | $52,200 | $12,000 | $40,200 |
| 2017 | $1,488 | $120,300 | $12,000 | $36,120 |
| 2016 | $1,139 | $110,600 | $10,000 | $34,240 |
| 2015 | $997 | $96,000 | $8,800 | $29,600 |
| 2014 | $1,124 | $87,200 | $8,000 | $26,880 |
Source: Public Records
Map
Nearby Homes
- 1187 Lightfoot Dr
- 3548 Cherokee Overlook Dr
- 1720 Hickory Flat Hwy
- 443 Southland Cir
- 105 Summerlin Dr
- 313 Spring Hill Dr
- 503 Pinnacle Ct
- 231 Breeze Hill Ln
- 365 Russell King Ln
- 150 Mountain Vista Blvd
- 0 Reed St Unit 7646438
- 317 Cabinwood Trail
- 199 Mountain Vista Blvd
- 302 and 304 Garland Way
- 0 Governors Walk Dr Unit 7294252
- 253 Newt Fowler Ln
- 103 Brooke Park Dr
- 2790 Hickory Flat Hwy
- 131 E Killian St
- 145 E Killian St
- 826 Overlook Trail Unit 75
- 828 Overlook Trail Unit 3
- 824 Overlook Trail
- 830 Overlook Trail Unit 3
- 524 Cherokee Overlook Ct
- 822 Overlook Trail
- 520 Cherokee Overlook Ct
- 526 Cherokee Overlook Ct Unit III
- 516 Cherokee Overlook Ct
- 833 Overlook Trail
- 835 Overlook Trail
- 528 Cherokee Overlook Ct
- 820 Overlook Trail
- 831 Overlook Trail
- 512 Cherokee Overlook Ct
- 837 Overlook Trail
- 829 Overlook Trail Unit III
- 0 Cherokee Overlook Ct Unit 10154913
- 000 Cherokee Overlook Ct
- 0 Cherokee Overlook Ct Unit 6890811
Your Personal Tour Guide
Ask me questions while you tour the home.