Estimated Value: $674,000 - $784,000
5
Beds
4
Baths
4,181
Sq Ft
$171/Sq Ft
Est. Value
About This Home
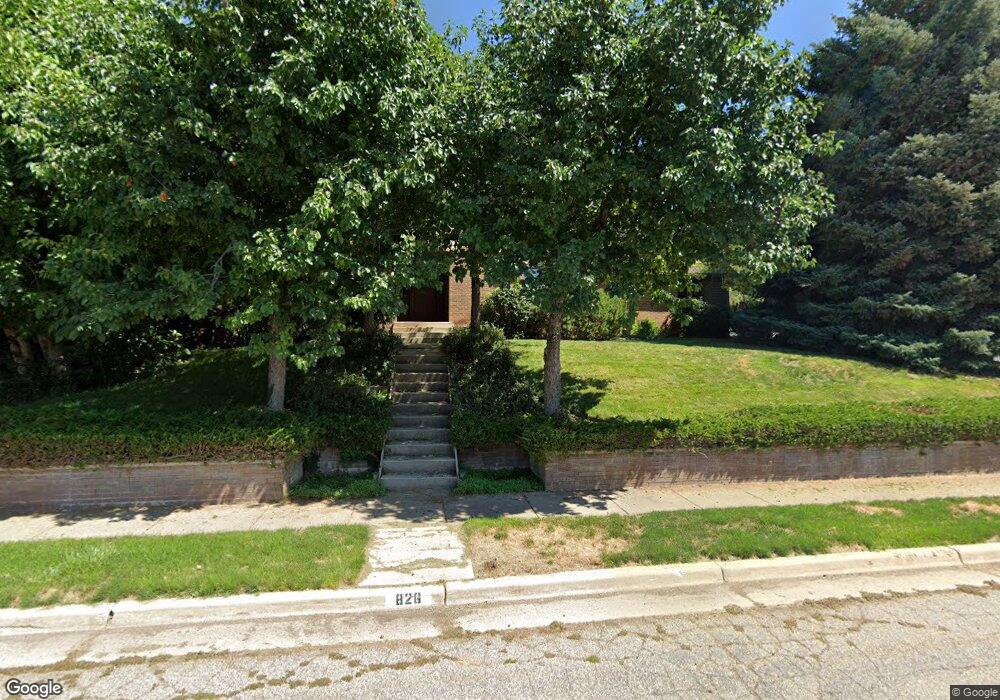
This home is located at 826 W 4000 N, Ogden, UT 84414 and is currently estimated at $716,581, approximately $171 per square foot. 826 W 4000 N is a home located in Weber County with nearby schools including Lomond View School, Orion Junior High School, and Weber High School.
Ownership History
Date
Name
Owned For
Owner Type
Purchase Details
Closed on
May 26, 2009
Sold by
Olds Paul and Olds Taryn
Bought by
Olds Paul H
Current Estimated Value
Home Financials for this Owner
Home Financials are based on the most recent Mortgage that was taken out on this home.
Original Mortgage
$185,000
Outstanding Balance
$113,571
Interest Rate
4.25%
Mortgage Type
Stand Alone Refi Refinance Of Original Loan
Estimated Equity
$603,010
Purchase Details
Closed on
Aug 16, 2004
Sold by
The Christine Browning Richards Revocabl
Bought by
Olds Paul
Create a Home Valuation Report for This Property
The Home Valuation Report is an in-depth analysis detailing your home's value as well as a comparison with similar homes in the area
Home Values in the Area
Average Home Value in this Area
Purchase History
We collect this data history from publicly available records. To have your information removed, we recommend requesting removal directly through your county’s website.
| Date | Buyer | Sale Price | Title Company |
|---|---|---|---|
| Olds Paul H | -- | Backman Ntp | |
| Olds Paul | -- | Mountain View Title |
Source: Public Records
Mortgage History
We collect this data history from publicly available records. To have your information removed, we recommend requesting removal directly through your county’s website.
| Date | Status | Borrower | Loan Amount |
|---|---|---|---|
| Open | Olds Paul H | $185,000 |
Source: Public Records
Tax History
| Year | Tax Paid | Tax Assessment Tax Assessment Total Assessment is a certain percentage of the fair market value that is determined by local assessors to be the total taxable value of land and additions on the property. | Land | Improvement |
|---|---|---|---|---|
| 2025 | $4,510 | $679,694 | $159,241 | $520,453 |
| 2024 | $4,327 | $366,849 | $87,582 | $279,267 |
| 2023 | $3,887 | $329,450 | $87,573 | $241,877 |
| 2022 | $3,644 | $315,700 | $87,573 | $228,127 |
| 2021 | $3,252 | $474,000 | $89,515 | $384,485 |
| 2020 | $3,018 | $404,000 | $74,598 | $329,402 |
| 2019 | $3,086 | $396,000 | $67,572 | $328,428 |
| 2018 | $3,037 | $374,000 | $67,572 | $306,428 |
| 2017 | $2,967 | $345,000 | $67,572 | $277,428 |
| 2016 | $2,742 | $172,649 | $32,755 | $139,894 |
| 2015 | $2,758 | $172,649 | $40,975 | $131,674 |
| 2014 | $2,295 | $137,292 | $40,975 | $96,317 |
Source: Public Records
Map
Nearby Homes
Your Personal Tour Guide
Ask me questions while you tour the home.