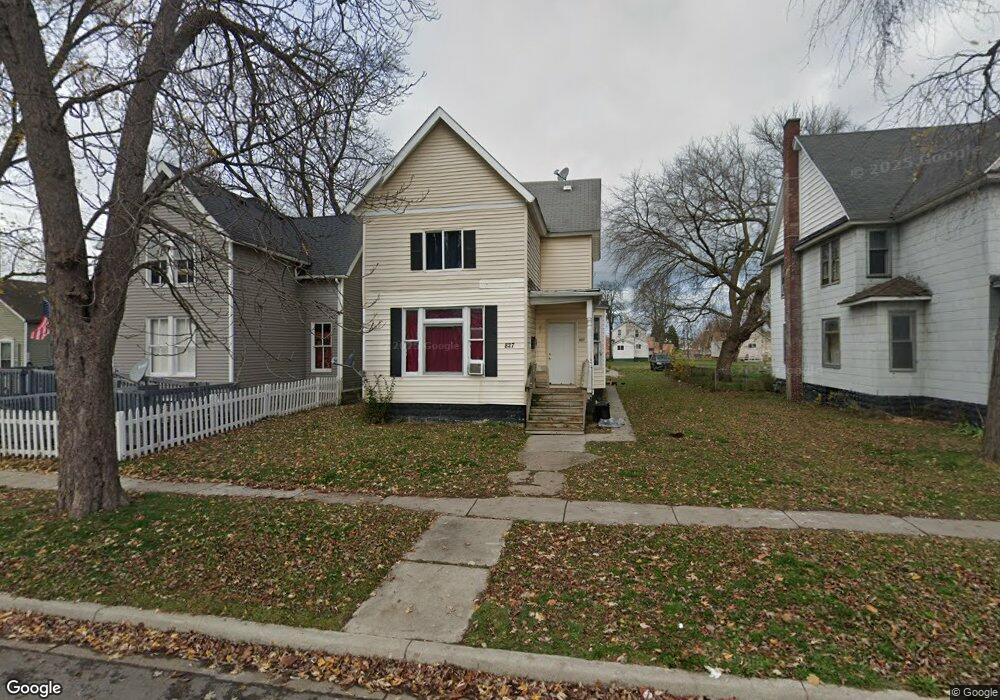
827 Pine St Port Huron, MI 48060
Estimated Value: $127,000 - $156,000
5
Beds
4
Baths
2,720
Sq Ft
$51/Sq Ft
Est. Value
About This Home
This home is located at 827 Pine St, Port Huron, MI 48060 and is currently estimated at $138,077, approximately $50 per square foot. 827 Pine St is a home located in St. Clair County with nearby schools including Woodrow Wilson Elementary School, Holland Woods Middle School, and Port Huron High School.
Ownership History
Date
Name
Owned For
Owner Type
Purchase Details
Closed on
Aug 1, 2024
Sold by
Barcume John and Barcume Todd
Bought by
Greener Planet Llc
Current Estimated Value
Purchase Details
Closed on
Mar 1, 2018
Sold by
Lemley Christina
Bought by
Barcume John and Barcume Todd
Purchase Details
Closed on
Oct 1, 2009
Sold by
Barlume John
Bought by
Barlume John and Barlume Todd
Purchase Details
Closed on
Sep 1, 2009
Sold by
Barcume John
Bought by
Gold Rey Rentals Inc
Create a Home Valuation Report for This Property
The Home Valuation Report is an in-depth analysis detailing your home's value as well as a comparison with similar homes in the area
Home Values in the Area
Average Home Value in this Area
Purchase History
| Date | Buyer | Sale Price | Title Company |
|---|---|---|---|
| Greener Planet Llc | $140,000 | Philip F Greco Title | |
| Barcume John | -- | None Available | |
| Barlume John | -- | None Available | |
| Gold Rey Rentals Inc | -- | None Available | |
| Barcume John | -- | None Available |
Source: Public Records
Tax History
| Year | Tax Paid | Tax Assessment Tax Assessment Total Assessment is a certain percentage of the fair market value that is determined by local assessors to be the total taxable value of land and additions on the property. | Land | Improvement |
|---|---|---|---|---|
| 2025 | $4,193 | $66,000 | $0 | $0 |
| 2024 | $1,984 | $62,500 | $0 | $0 |
| 2023 | $1,879 | $51,900 | $0 | $0 |
| 2022 | $1,882 | $43,000 | $0 | $0 |
| 2020 | $2,047 | $32,100 | $32,100 | $0 |
| 2019 | $1,834 | $23,400 | $0 | $0 |
| 2018 | $1,799 | $23,400 | $0 | $0 |
| 2017 | $1,407 | $21,100 | $0 | $0 |
| 2016 | $1,070 | $21,100 | $0 | $0 |
| 2015 | $1,050 | $20,500 | $20,500 | $0 |
| 2014 | $1,050 | $19,500 | $19,500 | $0 |
| 2013 | -- | $19,500 | $0 | $0 |
Source: Public Records
Map
Nearby Homes
Your Personal Tour Guide
Ask me questions while you tour the home.