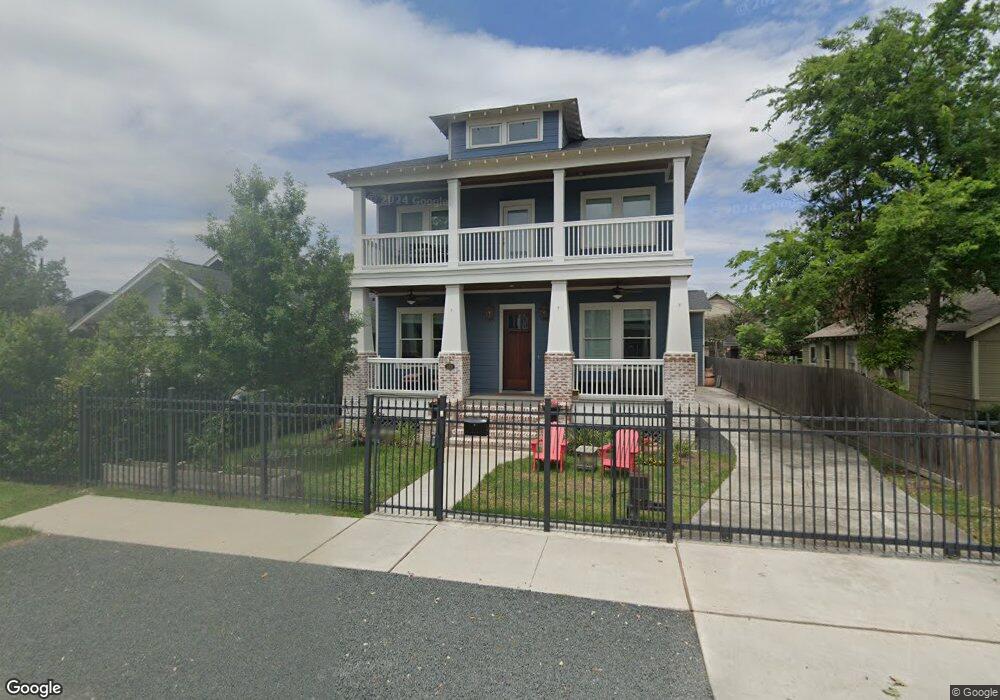
829 E 28th St Unit Gar Apt Houston, TX 77009
Greater Heights NeighborhoodEstimated Value: $512,000 - $994,000
1
Bed
1
Bath
660
Sq Ft
$1,083/Sq Ft
Est. Value
About This Home
This home is located at 829 E 28th St Unit Gar Apt, Houston, TX 77009 and is currently estimated at $714,855, approximately $1,083 per square foot. 829 E 28th St Unit Gar Apt is a home located in Harris County with nearby schools including Field Elementary School, Hamilton Middle, and Heights High School.
Ownership History
Date
Name
Owned For
Owner Type
Purchase Details
Closed on
Apr 9, 2008
Sold by
Huffstetler Sheri H
Bought by
Huffstetler William Jackson
Current Estimated Value
Purchase Details
Closed on
Apr 17, 2006
Sold by
Nash Leonard
Bought by
Huffstetler William J and Kiecke Kenneth K
Home Financials for this Owner
Home Financials are based on the most recent Mortgage that was taken out on this home.
Original Mortgage
$22,200
Interest Rate
6.33%
Mortgage Type
Fannie Mae Freddie Mac
Create a Home Valuation Report for This Property
The Home Valuation Report is an in-depth analysis detailing your home's value as well as a comparison with similar homes in the area
Home Values in the Area
Average Home Value in this Area
Purchase History
| Date | Buyer | Sale Price | Title Company |
|---|---|---|---|
| Huffstetler William Jackson | -- | None Available | |
| Huffstetler William J | -- | American Title Co |
Source: Public Records
Mortgage History
| Date | Status | Borrower | Loan Amount |
|---|---|---|---|
| Closed | Huffstetler William J | $22,200 | |
| Open | Huffstetler William J | $111,000 |
Source: Public Records
Tax History
| Year | Tax Paid | Tax Assessment Tax Assessment Total Assessment is a certain percentage of the fair market value that is determined by local assessors to be the total taxable value of land and additions on the property. | Land | Improvement |
|---|---|---|---|---|
| 2025 | $14,399 | $869,639 | $450,000 | $419,639 |
| 2024 | $14,399 | $910,519 | $420,000 | $490,519 |
| 2023 | $14,399 | $967,139 | $420,000 | $547,139 |
| 2022 | $18,484 | $852,468 | $360,000 | $492,468 |
| 2021 | $17,787 | $763,167 | $288,000 | $475,167 |
| 2020 | $16,827 | $694,856 | $288,000 | $406,856 |
| 2019 | $13,144 | $519,449 | $288,000 | $231,449 |
| 2018 | $6,832 | $270,000 | $269,900 | $100 |
| 2017 | $6,827 | $270,000 | $269,900 | $100 |
| 2016 | $6,574 | $260,000 | $240,000 | $20,000 |
| 2015 | -- | $303,935 | $240,000 | $63,935 |
| 2014 | -- | $230,694 | $180,000 | $50,694 |
Source: Public Records
Map
Nearby Homes
- 842 E 29th St
- 2811 Princeton St
- 826 E 29th St
- 2810 Princeton St
- 2806 Princeton St
- 1327 & 1329 North Loop
- 828 E 28th St
- 806 E 29th St
- 803 E 29th St
- 829 E 27th St
- 902 E 27th St
- 830 E 27th St
- 1035 E 28th St
- 917 North Loop
- 803 North Loop
- 1107 E 27th St
- 1016 E 27th St
- 802 E 32nd St
- 1113 E 27th St
- 919 E 32nd St
Your Personal Tour Guide
Ask me questions while you tour the home.