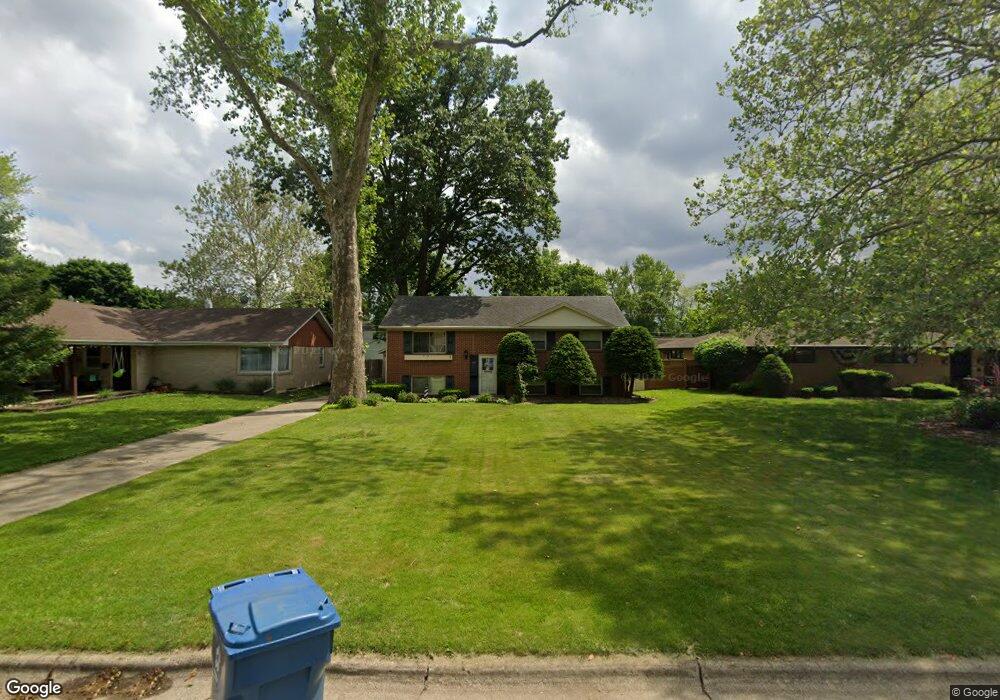
829 E Chapin St Morris, IL 60450
Estimated Value: $213,000 - $236,000
Studio
--
Bath
1,040
Sq Ft
$218/Sq Ft
Est. Value
About This Home
This home is located at 829 E Chapin St, Morris, IL 60450 and is currently estimated at $226,506, approximately $217 per square foot. 829 E Chapin St is a home with nearby schools including White Oak Elementary School, Shabbona Middle School, and Morris Community High School.
Ownership History
Date
Name
Owned For
Owner Type
Purchase Details
Closed on
Sep 4, 2024
Sold by
Dolmage Marchene R and Fisher Marchene
Bought by
Marchene Fisher Revocable Living Trust
Current Estimated Value
Purchase Details
Closed on
Apr 9, 2018
Sold by
Dolmage Marchene R and Fisher Marchene R
Bought by
Marchene R Fisher Revocable Trt
Create a Home Valuation Report for This Property
The Home Valuation Report is an in-depth analysis detailing your home's value as well as a comparison with similar homes in the area
Purchase History
| Date | Buyer | Sale Price | Title Company |
|---|---|---|---|
| Marchene Fisher Revocable Living Trust | -- | None Listed On Document | |
| Marchene R Fisher Revocable Trt | -- | None Available |
Source: Public Records
Tax History
| Year | Tax Paid | Tax Assessment Tax Assessment Total Assessment is a certain percentage of the fair market value that is determined by local assessors to be the total taxable value of land and additions on the property. | Land | Improvement |
|---|---|---|---|---|
| 2024 | $5,536 | $70,730 | $12,149 | $58,581 |
| 2023 | $5,213 | $66,613 | $11,442 | $55,171 |
| 2022 | $3,948 | $61,439 | $10,553 | $50,886 |
| 2021 | $3,738 | $58,104 | $9,980 | $48,124 |
| 2020 | $3,673 | $56,620 | $9,725 | $46,895 |
| 2019 | $3,417 | $53,668 | $9,218 | $44,450 |
| 2018 | $3,347 | $52,627 | $9,039 | $43,588 |
| 2017 | $3,103 | $49,860 | $8,564 | $41,296 |
| 2016 | $3,067 | $49,469 | $8,497 | $40,972 |
| 2015 | $1,459 | $47,489 | $8,157 | $39,332 |
| 2014 | $1,372 | $46,249 | $7,944 | $38,305 |
| 2013 | $1,412 | $48,090 | $8,260 | $39,830 |
Source: Public Records
Map
Nearby Homes
- 812 1/2 E Benton St
- 831 Douglas St
- 804 E Jefferson St
- 524 E Chapin St
- 628 E Main St
- 511 Armstrong St
- 911 E Washington St
- 816 2nd Ave
- 815 Kiersted St
- 1224 Grant St
- 329 Robinson Dr
- 1 By Railroad Track
- 409 Mckinley St
- 1233 Oak Grove Ct
- 1220 Liberty St
- 1595 W Us Rte 6
- 1.88 Acres Rd
- LOT 5 Henry St
- 1112 & 1112 1/2 Butler St
- 1368 Heritage Dr
- 835 E Chapin St
- 824 E North St
- 815 E Chapin St
- 839 E Chapin St
- 804 E North St
- 836 E North St
- 627 Spruce St
- 843 E Chapin St
- 830 E Chapin St
- 830 E Chapin St
- 830 E Chapin St
- 840 E North St
- 800 E North St
- 844 E Chapin St
- 849 E Chapin St
- 705 Spruce St
- 848 E Chapin St
- 853 E Chapin St
- 821 E North St
- 809 E North St
Your Personal Tour Guide
Ask me questions while you tour the home.