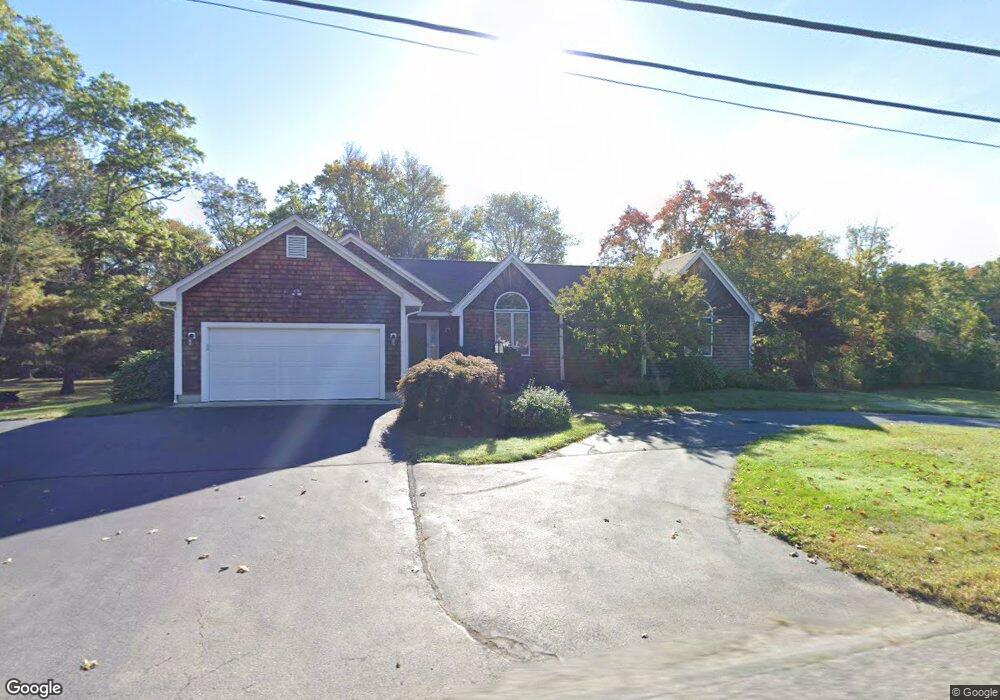
83 Anawan St Rehoboth, MA 02769
Estimated Value: $635,017 - $854,000
4
Beds
2
Baths
2,046
Sq Ft
$358/Sq Ft
Est. Value
About This Home
This home is located at 83 Anawan St, Rehoboth, MA 02769 and is currently estimated at $733,254, approximately $358 per square foot. 83 Anawan St is a home located in Bristol County with nearby schools including Dighton-Rehoboth Regional High School, Cedar Brook School, and Grace Baptist Christian Academy.
Ownership History
Date
Name
Owned For
Owner Type
Purchase Details
Closed on
Sep 14, 2025
Sold by
Karavolis Michael G
Bought by
Broke Down Palace Rt and Karavolis
Current Estimated Value
Purchase Details
Closed on
Nov 23, 2009
Sold by
Karavolis Michael G and Karavolis Denise C
Bought by
Karavolis Michael G
Home Financials for this Owner
Home Financials are based on the most recent Mortgage that was taken out on this home.
Original Mortgage
$220,000
Interest Rate
4.86%
Mortgage Type
Purchase Money Mortgage
Purchase Details
Closed on
Mar 30, 1992
Sold by
Ferrini Joseph
Bought by
Karavolis Michael and Crookes Denise C
Create a Home Valuation Report for This Property
The Home Valuation Report is an in-depth analysis detailing your home's value as well as a comparison with similar homes in the area
Home Values in the Area
Average Home Value in this Area
Purchase History
| Date | Buyer | Sale Price | Title Company |
|---|---|---|---|
| Broke Down Palace Rt | -- | -- | |
| Karavolis Michael G | -- | -- | |
| Karavolis Michael G | -- | -- | |
| Karavolis Michael | $178,500 | -- |
Source: Public Records
Mortgage History
| Date | Status | Borrower | Loan Amount |
|---|---|---|---|
| Previous Owner | Karavolis Michael | $25,000 | |
| Previous Owner | Karavolis Michael G | $220,000 |
Source: Public Records
Tax History
| Year | Tax Paid | Tax Assessment Tax Assessment Total Assessment is a certain percentage of the fair market value that is determined by local assessors to be the total taxable value of land and additions on the property. | Land | Improvement |
|---|---|---|---|---|
| 2025 | $5,927 | $531,600 | $174,300 | $357,300 |
| 2024 | $5,462 | $480,800 | $174,300 | $306,500 |
| 2023 | $5,310 | $458,000 | $170,700 | $287,300 |
| 2022 | $5,310 | $419,100 | $170,700 | $248,400 |
| 2021 | $5,116 | $386,400 | $162,900 | $223,500 |
| 2020 | $4,840 | $368,900 | $162,900 | $206,000 |
| 2018 | $4,351 | $363,500 | $155,100 | $208,400 |
| 2017 | $3,982 | $317,000 | $155,100 | $161,900 |
| 2016 | $3,915 | $322,200 | $155,100 | $167,100 |
| 2015 | $3,623 | $294,300 | $147,900 | $146,400 |
| 2014 | $3,572 | $287,100 | $140,700 | $146,400 |
Source: Public Records
Map
Nearby Homes
- 58 Peck St
- 43 Smith St
- 48 Round Farm Rd
- 52 Round Farm Rd
- 1 Round Farm Rd
- 40 Duffy Dr
- 240 Smith St
- 49 Teaberry Ln
- 257 Anawan St
- 20 Mine Brook Rd
- 15 Ralsie Rd
- 34 Hitchcock Ln
- Lot 11 Ledge Hill Ln
- 133 Winthrop St
- 27 Coleman Ave
- 71 Agricultural Ave
- 7 Ledge Hill Ln
- 438 Tremont St
- 3 Wilmarth St
- 245 Perryville Rd
Your Personal Tour Guide
Ask me questions while you tour the home.