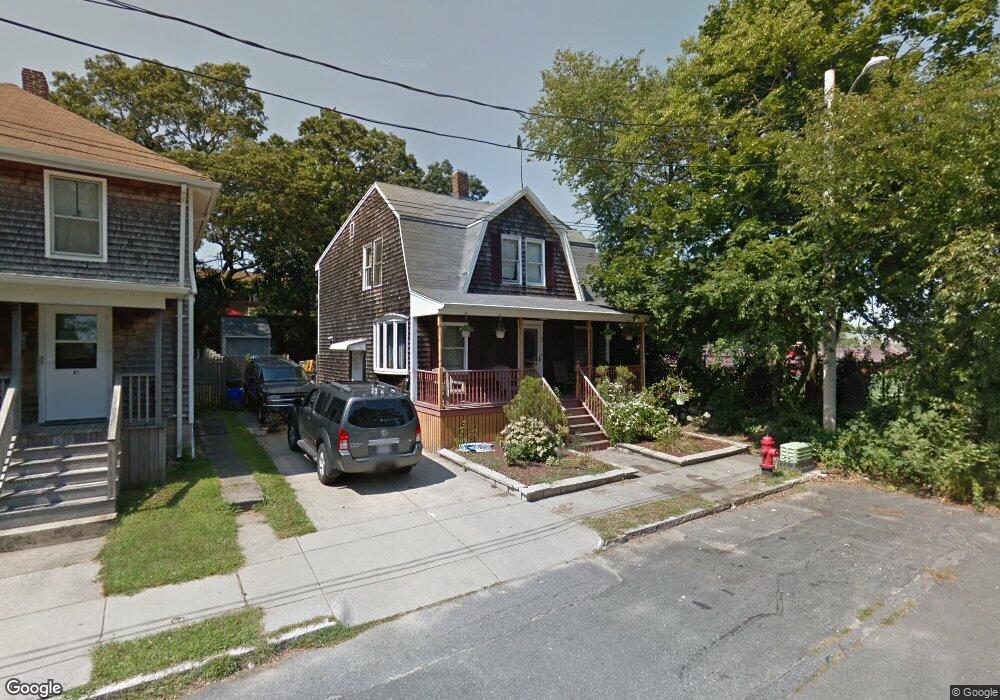
83 Beech St New Bedford, MA 02740
Downtown New Bedford NeighborhoodEstimated Value: $374,657 - $432,000
3
Beds
2
Baths
1,302
Sq Ft
$318/Sq Ft
Est. Value
About This Home
This home is located at 83 Beech St, New Bedford, MA 02740 and is currently estimated at $413,664, approximately $317 per square foot. 83 Beech St is a home located in Bristol County with nearby schools including Elizabeth Carter Brooks Elementary School, Keith Middle School, and New Bedford High School.
Ownership History
Date
Name
Owned For
Owner Type
Purchase Details
Closed on
Dec 29, 2000
Sold by
Faria Joao R and Faria Iolanda M
Bought by
Barboza Corey S and Barboza Kerri L
Current Estimated Value
Home Financials for this Owner
Home Financials are based on the most recent Mortgage that was taken out on this home.
Original Mortgage
$121,900
Interest Rate
7.7%
Mortgage Type
Purchase Money Mortgage
Purchase Details
Closed on
Nov 30, 1987
Sold by
Tripp Bradford S
Bought by
Faria Foao R
Create a Home Valuation Report for This Property
The Home Valuation Report is an in-depth analysis detailing your home's value as well as a comparison with similar homes in the area
Home Values in the Area
Average Home Value in this Area
Purchase History
| Date | Buyer | Sale Price | Title Company |
|---|---|---|---|
| Barboza Corey S | $122,000 | -- | |
| Barboza Corey S | $122,000 | -- | |
| Faria Foao R | $65,000 | -- |
Source: Public Records
Mortgage History
| Date | Status | Borrower | Loan Amount |
|---|---|---|---|
| Open | Faria Foao R | $158,000 | |
| Closed | Faria Foao R | $15,000 | |
| Closed | Faria Foao R | $121,900 |
Source: Public Records
Tax History
| Year | Tax Paid | Tax Assessment Tax Assessment Total Assessment is a certain percentage of the fair market value that is determined by local assessors to be the total taxable value of land and additions on the property. | Land | Improvement |
|---|---|---|---|---|
| 2025 | $3,679 | $325,300 | $94,300 | $231,000 |
| 2024 | $3,338 | $278,200 | $87,600 | $190,600 |
| 2023 | $3,480 | $243,500 | $74,100 | $169,400 |
| 2022 | $3,110 | $200,100 | $67,400 | $132,700 |
| 2021 | $0 | $188,400 | $64,000 | $124,400 |
| 2020 | $0 | $172,200 | $64,000 | $108,200 |
| 2019 | $2,673 | $162,300 | $64,000 | $98,300 |
| 2018 | $0 | $149,400 | $64,000 | $85,400 |
| 2017 | $2,368 | $141,900 | $62,300 | $79,600 |
| 2016 | $2,262 | $137,200 | $60,600 | $76,600 |
| 2015 | $2,128 | $135,300 | $60,600 | $74,700 |
| 2014 | $2,209 | $145,700 | $59,000 | $86,700 |
Source: Public Records
Map
Nearby Homes
Your Personal Tour Guide
Ask me questions while you tour the home.