83 Cross St Reading, MA 01867
Reading AreaEstimated Value: $980,000 - $1,093,000
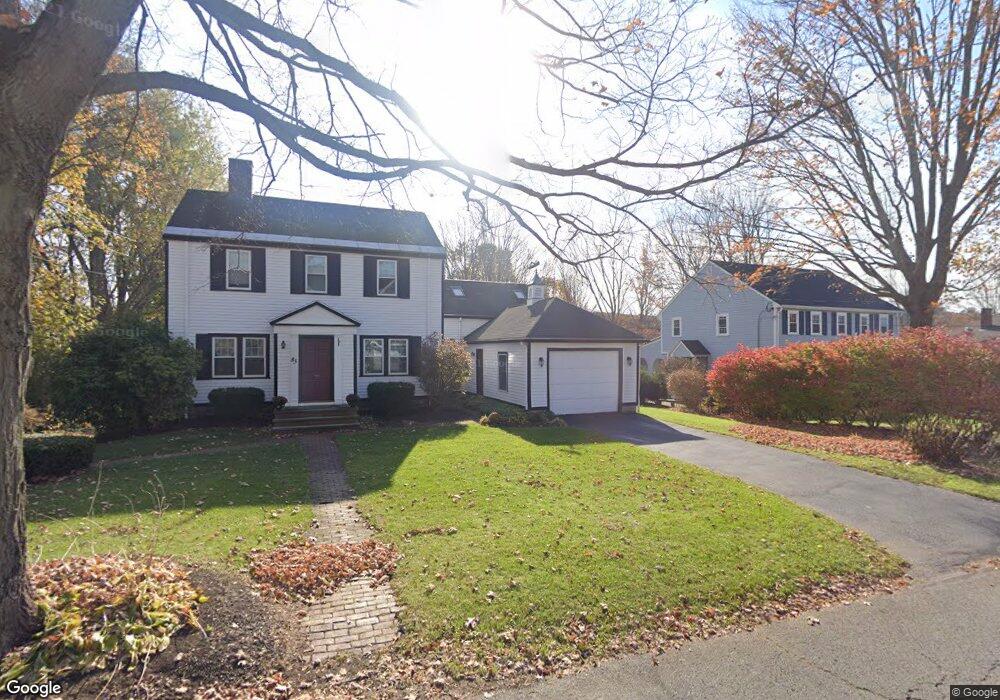
About This Home
This home is located at 83 Cross St, Reading, MA 01867 and is currently estimated at $1,045,302, approximately $470 per square foot. 83 Cross St is a home located in Middlesex County with nearby schools including J. Warren Killam Elementary School, Walter S. Parker Middle School, and Reading Memorial High School.
Ownership History
We collect this data history from publicly available records. To have your information removed, we recommend requesting removal directly through your county’s website.
Purchase Details
Purchase Details
Home Values in the Area
Average Home Value in this Area
Purchase History
We collect this data history from publicly available records. To have your information removed, we recommend requesting removal directly through your county’s website.
| Date | Buyer | Sale Price | Title Company |
|---|---|---|---|
| $360,000 | -- | ||
| $290,000 | -- |
Mortgage History
We collect this data history from publicly available records. To have your information removed, we recommend requesting removal directly through your county’s website.
| Date | Status | Borrower | Loan Amount |
|---|---|---|---|
| Open | $400,000 | ||
| Closed | $100,000 | ||
| Closed | $270,000 | ||
| Closed | $236,500 | ||
| Closed | $240,950 | ||
| Closed | $50,000 |
Tax History
We collect this data history from publicly available records. To have your information removed, we recommend requesting removal directly through your county’s website.
| Year | Tax Paid | Tax Assessment Tax Assessment Total Assessment is a certain percentage of the fair market value that is determined by local assessors to be the total taxable value of land and additions on the property. | Land | Improvement |
|---|---|---|---|---|
| 2025 | $10,715 | $940,700 | $540,200 | $400,500 |
| 2024 | $10,399 | $887,300 | $509,300 | $378,000 |
| 2023 | $10,644 | $845,400 | $485,100 | $360,300 |
| 2022 | $10,253 | $769,200 | $441,000 | $328,200 |
| 2021 | $13,156 | $713,700 | $413,100 | $300,600 |
| 2020 | $9,432 | $676,100 | $391,100 | $285,000 |
| 2019 | $9,167 | $644,200 | $372,500 | $271,700 |
| 2018 | $8,493 | $612,300 | $353,800 | $258,500 |
| 2017 | $20,317 | $586,200 | $338,600 | $247,600 |
| 2016 | $7,476 | $515,600 | $287,000 | $228,600 |
| 2015 | $7,222 | $491,300 | $273,300 | $218,000 |
| 2014 | $7,442 | $504,900 | $301,600 | $203,300 |
Map
- 295 Main St Unit 16
- 24 Pinevale Ave
- 13 Percy Ave
- 713 Gazebo Cir Unit 713
- 3 Summit Dr Unit 17
- 2 Summit Dr Unit 41
- 400 Main St
- 116 Parker Rd
- 42 Riverside Dr
- ONE Summit Dr Unit 57
- 531 Main St Unit 1002
- 67 Washington St
- 12 Lakeview Ave
- 16 Elm St
- 62 Abigail Way Unit 1006
- 62 Abigail Way Unit 4006
- 62 Abigail Way Unit 4007
- 36 Abigail Way Unit 1009
- 23 Augustus Ct Unit 4003
- 49 Salem St Unit 1
Ask me questions while you tour the home.