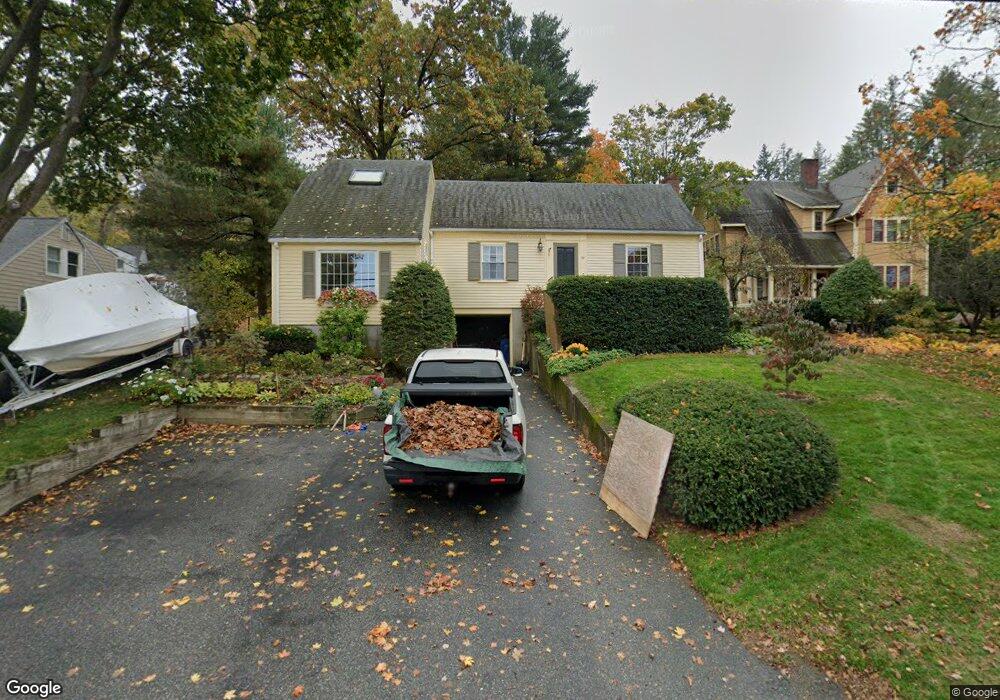
83 Elm St Wakefield, MA 01880
West Side NeighborhoodEstimated Value: $792,000 - $852,000
3
Beds
2
Baths
1,883
Sq Ft
$438/Sq Ft
Est. Value
About This Home
This home is located at 83 Elm St, Wakefield, MA 01880 and is currently estimated at $825,412, approximately $438 per square foot. 83 Elm St is a home located in Middlesex County with nearby schools including Wakefield Memorial High School and St Joseph School.
Ownership History
Date
Name
Owned For
Owner Type
Purchase Details
Closed on
Oct 23, 2019
Sold by
Conley William T and Conley Margaret R
Bought by
W Conley Ret
Current Estimated Value
Purchase Details
Closed on
Nov 28, 1980
Bought by
Conley William T and Conley Margaret R
Create a Home Valuation Report for This Property
The Home Valuation Report is an in-depth analysis detailing your home's value as well as a comparison with similar homes in the area
Home Values in the Area
Average Home Value in this Area
Purchase History
We collect this data history from publicly available records. To have your information removed, we recommend requesting removal directly through your county’s website.
| Date | Buyer | Sale Price | Title Company |
|---|---|---|---|
| W Conley Ret | -- | None Available | |
| Conley William T | $69,000 | -- |
Source: Public Records
Mortgage History
We collect this data history from publicly available records. To have your information removed, we recommend requesting removal directly through your county’s website.
| Date | Status | Borrower | Loan Amount |
|---|---|---|---|
| Previous Owner | Conley William T | $88,500 | |
| Previous Owner | Conley William T | $9,000 | |
| Previous Owner | Conley William T | $76,200 |
Source: Public Records
Tax History
| Year | Tax Paid | Tax Assessment Tax Assessment Total Assessment is a certain percentage of the fair market value that is determined by local assessors to be the total taxable value of land and additions on the property. | Land | Improvement |
|---|---|---|---|---|
| 2025 | $8,455 | $744,900 | $412,500 | $332,400 |
| 2024 | $8,134 | $723,000 | $400,400 | $322,600 |
| 2023 | $7,854 | $669,600 | $370,700 | $298,900 |
| 2022 | $7,502 | $608,900 | $337,000 | $271,900 |
| 2021 | $7,045 | $553,400 | $313,400 | $240,000 |
| 2020 | $6,776 | $530,600 | $300,500 | $230,100 |
| 2019 | $6,573 | $512,300 | $290,100 | $222,200 |
| 2018 | $6,220 | $480,300 | $272,000 | $208,300 |
| 2017 | $5,960 | $457,400 | $259,000 | $198,400 |
| 2016 | $5,755 | $426,600 | $239,600 | $187,000 |
| 2015 | $5,377 | $398,900 | $224,000 | $174,900 |
| 2014 | $4,939 | $386,500 | $217,000 | $169,500 |
Source: Public Records
Map
Nearby Homes
- 13 Parker Rd
- 1 Summit Dr Unit 24
- 1 Summit Dr Unit 58
- 1 Summit Dr Unit 57
- 3 Walnut St
- 84 Converse St
- 47 Winship Dr
- 284 Main St
- 26-26A Richardson Ave
- 175 North Ave Unit 407
- 293 Albion St
- 20 Lawrence St Unit 2
- 7 Ballister St Unit 428
- 62 Foundry St Unit 312
- 62 Foundry St Unit 505
- 62 Foundry St Unit 202
- 269 Main St Unit 4001
- 159 Broadway St
- 6 Highland St
- 295 Main St Unit 15
Your Personal Tour Guide
Ask me questions while you tour the home.