83 High St Gloucester, MA 01930
Estimated Value: $740,000 - $841,000
About This Home
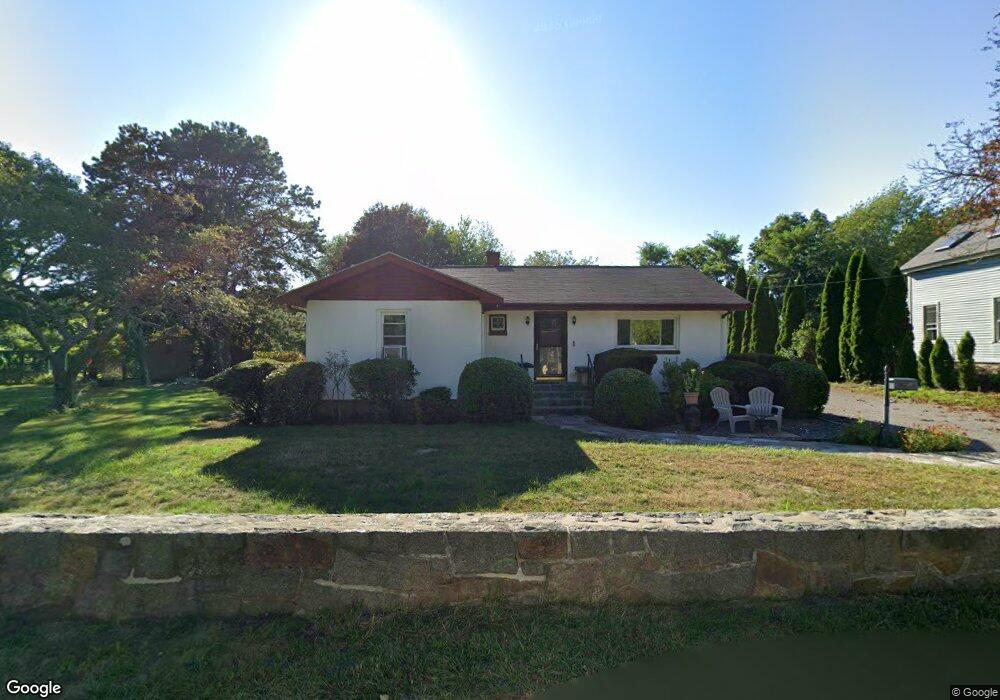
This home is located at 83 High St, Gloucester, MA 01930 and is currently estimated at $786,242, approximately $635 per square foot. 83 High St is a home located in Essex County with nearby schools including Plum Cove School, Ralph B O'maley Middle School, and Gloucester High School.
Ownership History
We collect this data history from publicly available records. To have your information removed, we recommend requesting removal directly through your county’s website.
Purchase Details
Purchase Details
Purchase History
We collect this data history from publicly available records. To have your information removed, we recommend requesting removal directly through your county’s website.
| Date | Buyer | Sale Price | Title Company |
|---|---|---|---|
| -- | -- | ||
| -- | -- |
Mortgage History
We collect this data history from publicly available records. To have your information removed, we recommend requesting removal directly through your county’s website.
| Date | Status | Borrower | Loan Amount |
|---|---|---|---|
| Previous Owner | $10,000 | ||
| Previous Owner | $12,000 |
Tax History
We collect this data history from publicly available records. To have your information removed, we recommend requesting removal directly through your county’s website.
| Year | Tax Paid | Tax Assessment Tax Assessment Total Assessment is a certain percentage of the fair market value that is determined by local assessors to be the total taxable value of land and additions on the property. | Land | Improvement |
|---|---|---|---|---|
| 2025 | $6,346 | $652,900 | $299,000 | $353,900 |
| 2024 | $6,161 | $633,200 | $284,800 | $348,400 |
| 2023 | $6,099 | $575,900 | $254,100 | $321,800 |
| 2022 | $5,722 | $487,800 | $216,100 | $271,700 |
| 2021 | $5,725 | $460,200 | $196,600 | $263,600 |
| 2020 | $5,389 | $437,100 | $196,600 | $240,500 |
| 2019 | $5,369 | $423,100 | $196,600 | $226,500 |
| 2018 | $5,327 | $412,000 | $196,600 | $215,400 |
| 2017 | $5,185 | $393,100 | $187,200 | $205,900 |
| 2016 | $4,970 | $365,200 | $187,700 | $177,500 |
| 2015 | $4,911 | $359,800 | $187,700 | $172,100 |
Map
- 43 High St Unit B
- 12 Andrews St
- 4 Langsford St
- 6 Mount Locust Place Unit 2
- 22 Woodbury St
- 3 Colburn St Unit 1
- 4 Ciaramitaro Ct
- 5 Ciaramitaro Ct
- 38 Revere St
- 1 C Pigeon Hill Ct Unit C
- 1 Pigeon Hill Ct Unit C
- 338 Granite St
- 17 Pigeon Hill St
- 136 Leonard St
- 245 Granite St
- 1 Pigeon Hill St
- 239 Granite St
- 14 Curtis St
- 184 Granite St
- 13 Phillips Ave
Ask me questions while you tour the home.