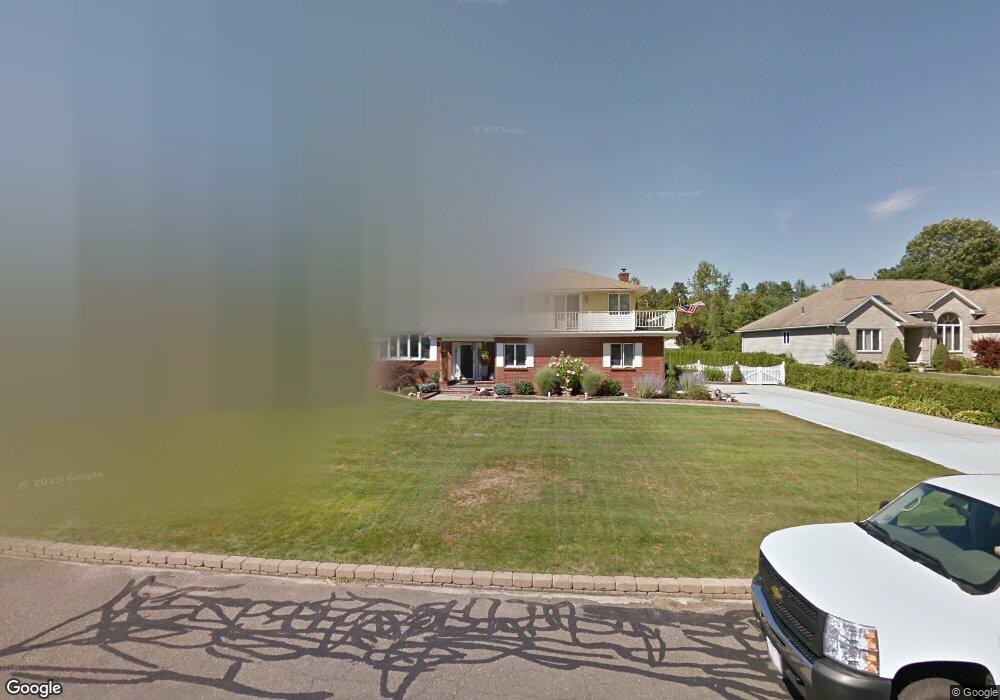
83 Higher Brook Dr Ludlow, MA 01056
Estimated Value: $430,000 - $524,000
About This Home
This home is located at 83 Higher Brook Dr, Ludlow, MA 01056 and is currently estimated at $458,390, approximately $269 per square foot. 83 Higher Brook Dr is a home located in Hampden County with nearby schools including East Street Elementary School, Chapin Street Elementary School, and Paul R. Baird Middle School.
Ownership History
We collect this data history from publicly available records. To have your information removed, we recommend requesting removal directly through your county’s website.
Purchase Details
Purchase Details
Home Values in the Area
Average Home Value in this Area
Purchase History
We collect this data history from publicly available records. To have your information removed, we recommend requesting removal directly through your county’s website.
| Date | Buyer | Sale Price | Title Company |
|---|---|---|---|
| -- | -- | ||
| -- | -- | ||
| $160,000 | -- | ||
| $160,000 | -- |
Mortgage History
We collect this data history from publicly available records. To have your information removed, we recommend requesting removal directly through your county’s website.
| Date | Status | Borrower | Loan Amount |
|---|---|---|---|
| Previous Owner | $95,000 | ||
| Previous Owner | $65,000 |
Tax History
We collect this data history from publicly available records. To have your information removed, we recommend requesting removal directly through your county’s website.
| Year | Tax Paid | Tax Assessment Tax Assessment Total Assessment is a certain percentage of the fair market value that is determined by local assessors to be the total taxable value of land and additions on the property. | Land | Improvement |
|---|---|---|---|---|
| 2025 | $6,338 | $365,300 | $95,200 | $270,100 |
| 2024 | $6,189 | $342,100 | $95,100 | $247,000 |
| 2023 | $6,001 | $307,600 | $83,500 | $224,100 |
| 2022 | $5,733 | $286,800 | $83,500 | $203,300 |
| 2021 | $5,780 | $274,200 | $83,500 | $190,700 |
| 2020 | $5,532 | $268,300 | $82,200 | $186,100 |
| 2019 | $5,232 | $264,000 | $81,400 | $182,600 |
| 2018 | $4,893 | $257,400 | $81,400 | $176,000 |
| 2017 | $4,725 | $255,000 | $78,400 | $176,600 |
| 2016 | $4,534 | $250,100 | $76,800 | $173,300 |
| 2015 | $4,184 | $242,000 | $69,900 | $172,100 |
Map
- 109 Booth St
- 980 Center St
- 15 Leland Dr
- 110 Nora Ln
- 75 Bridle Rd
- 597 Chapin St
- 84 Chapin Greene Dr
- 79 Chapin Greene Dr
- 72 Chapin Greene Dr
- 517 Ideal Ln Unit 603
- 128 Swan Ave
- 31 Harlan St
- 176 Genovevo Dr
- 78 King St
- 142 Marion Cir
- 308 Miller St Unit 77
- 308 Miller St Unit 79
- 353 Fuller St Unit 45
- 353 Fuller St Unit 4
- 111 Kirkland Ave
- 95 Higher Brook Dr
- 125 Higher Brook Dr
- 115 Higher Brook Dr
- 108 Higher Brook Dr
- 100 Higher Brook Dr
- 73 Higher Brook Dr
- 118 Higher Brook Dr
- 92 Higher Brook Dr
- 135 Higher Brook Dr
- 82 Higher Brook Dr
- 61 Higher Brook Dr
- 136 Higher Brook Dr
- 121 Richmond Rd
- 133 Richmond Rd
- 143 Higher Brook Dr
- 74 Higher Brook Dr
- 111 Richmond Rd
- 143 Richmond Rd
- 51 Higher Brook Dr
- 64 Higher Brook Dr
Ask me questions while you tour the home.