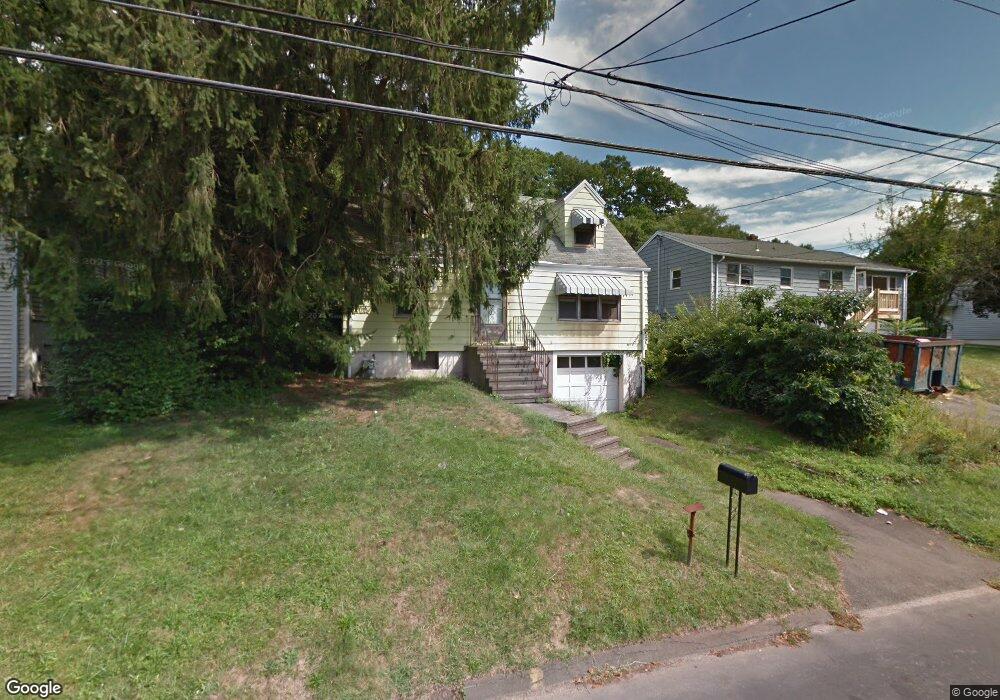
83 John St East Haven, CT 06513
Estimated Value: $246,186 - $402,000
2
Beds
1
Bath
1,075
Sq Ft
$305/Sq Ft
Est. Value
About This Home
This home is located at 83 John St, East Haven, CT 06513 and is currently estimated at $327,547, approximately $304 per square foot. 83 John St is a home located in New Haven County with nearby schools including Deer Run School, East Haven High School, and All Nations Christian Academy.
Ownership History
Date
Name
Owned For
Owner Type
Purchase Details
Closed on
Feb 27, 2006
Sold by
Termini Frank A and Termini Colline L
Bought by
Alberino James P and Alberino Julie B
Current Estimated Value
Home Financials for this Owner
Home Financials are based on the most recent Mortgage that was taken out on this home.
Original Mortgage
$223,985
Outstanding Balance
$126,587
Interest Rate
6.17%
Estimated Equity
$200,960
Create a Home Valuation Report for This Property
The Home Valuation Report is an in-depth analysis detailing your home's value as well as a comparison with similar homes in the area
Home Values in the Area
Average Home Value in this Area
Purchase History
| Date | Buyer | Sale Price | Title Company |
|---|---|---|---|
| Alberino James P | $227,500 | -- |
Source: Public Records
Mortgage History
| Date | Status | Borrower | Loan Amount |
|---|---|---|---|
| Open | Alberino James P | $5,505 | |
| Open | Alberino James P | $24,841 | |
| Open | Alberino James P | $223,985 | |
| Closed | Alberino James P | $8,200 |
Source: Public Records
Tax History
| Year | Tax Paid | Tax Assessment Tax Assessment Total Assessment is a certain percentage of the fair market value that is determined by local assessors to be the total taxable value of land and additions on the property. | Land | Improvement |
|---|---|---|---|---|
| 2025 | $3,577 | $106,960 | $37,310 | $69,650 |
| 2024 | $3,577 | $106,960 | $37,310 | $69,650 |
| 2023 | $3,337 | $106,960 | $37,310 | $69,650 |
| 2022 | $3,337 | $106,960 | $37,310 | $69,650 |
| 2021 | $3,022 | $88,230 | $34,610 | $53,620 |
| 2020 | $3,022 | $88,230 | $34,610 | $53,620 |
| 2019 | $2,860 | $88,230 | $34,610 | $53,620 |
| 2018 | $2,863 | $88,230 | $34,610 | $53,620 |
| 2017 | $2,784 | $88,230 | $34,610 | $53,620 |
| 2016 | $2,765 | $87,630 | $34,620 | $53,010 |
| 2015 | $2,765 | $87,630 | $34,620 | $53,010 |
| 2014 | $2,809 | $87,630 | $34,620 | $53,010 |
Source: Public Records
Map
Nearby Homes
- 173 Russo Ave Unit 304
- 173 Russo Ave Unit 408
- 116 Old Foxon Rd
- 65 Russo Ave Unit I4
- 21 Highland Ave
- 406 Strong St
- 104 Gene St
- 445 Strong St
- 427 Strong St
- 1423 Quinnipiac Ave Unit 808
- 1423 Quinnipiac Ave Unit 302
- 1423 Quinnipiac Ave Unit 304
- 1423 Quinnipiac Ave Unit 209
- 1423 Quinnipiac Ave Unit 812
- 1423 Quinnipiac Ave Unit 602
- 421 Strong St
- 1445 Quinnipiac Ave
- 1290 Quinnipiac Ave
- 255 Barnes Ave Unit 255
- 80 Roosevelt St
Your Personal Tour Guide
Ask me questions while you tour the home.