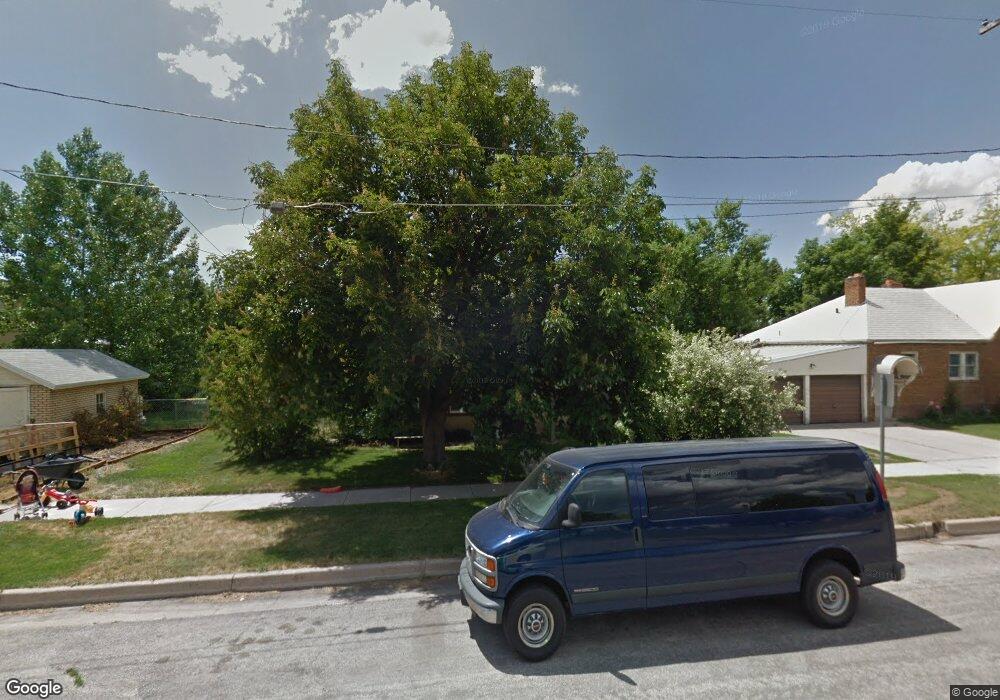
83 N 100 W Smithfield, UT 84335
Estimated Value: $326,000 - $376,000
4
Beds
1
Bath
1,470
Sq Ft
$242/Sq Ft
Est. Value
About This Home
This home is located at 83 N 100 W, Smithfield, UT 84335 and is currently estimated at $355,981, approximately $242 per square foot. 83 N 100 W is a home located in Cache County with nearby schools including Summit School, North Cache Middle School, and White Pine Middle School.
Ownership History
Date
Name
Owned For
Owner Type
Purchase Details
Closed on
Apr 25, 2008
Sold by
Sparks Lisa Mcbride and Sparks Lawrence M
Bought by
Hayward Steven and Hayward Carolee
Current Estimated Value
Home Financials for this Owner
Home Financials are based on the most recent Mortgage that was taken out on this home.
Original Mortgage
$119,003
Outstanding Balance
$75,260
Interest Rate
6.11%
Mortgage Type
FHA
Estimated Equity
$280,721
Create a Home Valuation Report for This Property
The Home Valuation Report is an in-depth analysis detailing your home's value as well as a comparison with similar homes in the area
Home Values in the Area
Average Home Value in this Area
Purchase History
We collect this data history from publicly available records. To have your information removed, we recommend requesting removal directly through your county’s website.
| Date | Buyer | Sale Price | Title Company |
|---|---|---|---|
| Hayward Steven | -- | Northern Title Company |
Source: Public Records
Mortgage History
We collect this data history from publicly available records. To have your information removed, we recommend requesting removal directly through your county’s website.
| Date | Status | Borrower | Loan Amount |
|---|---|---|---|
| Open | Hayward Steven | $119,003 |
Source: Public Records
Tax History
| Year | Tax Paid | Tax Assessment Tax Assessment Total Assessment is a certain percentage of the fair market value that is determined by local assessors to be the total taxable value of land and additions on the property. | Land | Improvement |
|---|---|---|---|---|
| 2025 | $1,289 | $172,595 | $0 | $0 |
| 2024 | $1,232 | $154,680 | $0 | $0 |
| 2023 | $1,302 | $154,630 | $0 | $0 |
| 2022 | $1,231 | $143,885 | $0 | $0 |
| 2021 | $116 | $206,864 | $70,000 | $136,864 |
| 2020 | $1,053 | $175,280 | $70,000 | $105,280 |
| 2019 | $947 | $150,280 | $45,000 | $105,280 |
| 2018 | $905 | $139,000 | $45,000 | $94,000 |
| 2017 | $771 | $64,625 | $0 | $0 |
| 2016 | $784 | $64,625 | $0 | $0 |
| 2015 | $787 | $64,625 | $0 | $0 |
| 2014 | $772 | $64,625 | $0 | $0 |
| 2013 | -- | $64,625 | $0 | $0 |
Source: Public Records
Map
Nearby Homes
Your Personal Tour Guide
Ask me questions while you tour the home.