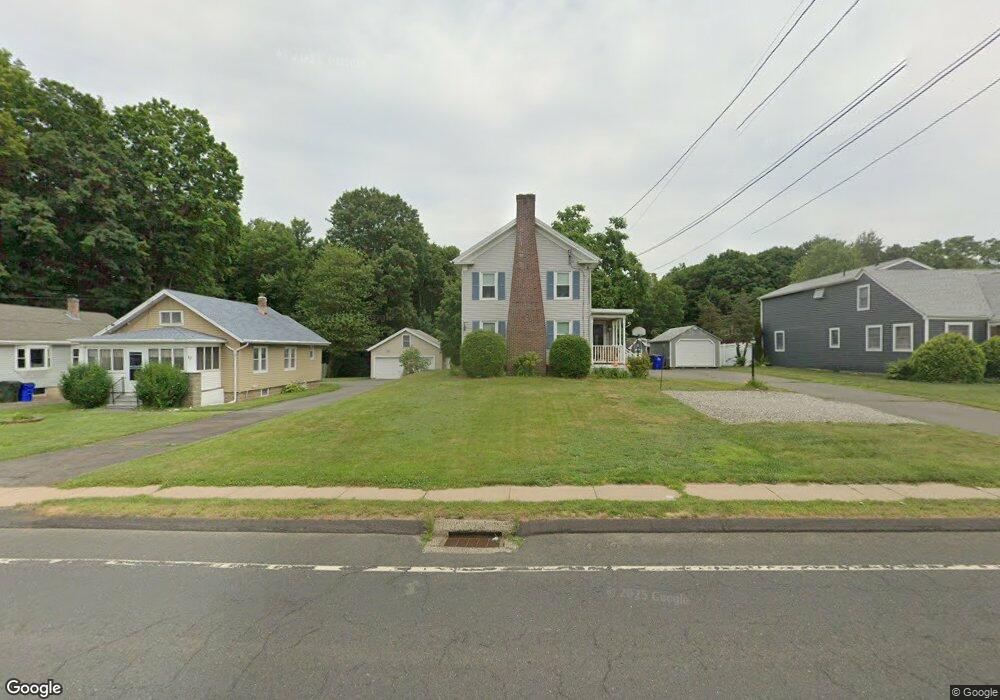
83 N Main St Windsor Locks, CT 06096
Estimated Value: $313,809 - $433,000
4
Beds
2
Baths
1,762
Sq Ft
$202/Sq Ft
Est. Value
About This Home
This home is located at 83 N Main St, Windsor Locks, CT 06096 and is currently estimated at $356,452, approximately $202 per square foot. 83 N Main St is a home located in Hartford County with nearby schools including North Street School, South Elementary School, and Windsor Locks Middle School.
Ownership History
Date
Name
Owned For
Owner Type
Purchase Details
Closed on
Oct 9, 2002
Sold by
Williamson John and Williamson Loraine W
Bought by
Prudential Res Svcs Lp
Current Estimated Value
Purchase Details
Closed on
Nov 2, 1992
Sold by
Anderson Mark and Anderson Cathy
Bought by
Fay Charles and Fay Gale
Create a Home Valuation Report for This Property
The Home Valuation Report is an in-depth analysis detailing your home's value as well as a comparison with similar homes in the area
Home Values in the Area
Average Home Value in this Area
Purchase History
| Date | Buyer | Sale Price | Title Company |
|---|---|---|---|
| Prudential Res Svcs Lp | $363,000 | -- | |
| Fay Charles | $137,900 | -- |
Source: Public Records
Mortgage History
| Date | Status | Borrower | Loan Amount |
|---|---|---|---|
| Open | Fay Charles | $110,011 | |
| Closed | Fay Charles | $71,000 | |
| Closed | Fay Charles | $117,930 |
Source: Public Records
Tax History
| Year | Tax Paid | Tax Assessment Tax Assessment Total Assessment is a certain percentage of the fair market value that is determined by local assessors to be the total taxable value of land and additions on the property. | Land | Improvement |
|---|---|---|---|---|
| 2025 | $4,470 | $186,340 | $55,020 | $131,320 |
| 2024 | $3,453 | $122,710 | $45,010 | $77,700 |
| 2023 | $3,231 | $122,710 | $45,010 | $77,700 |
| 2022 | $3,170 | $122,710 | $45,010 | $77,700 |
| 2021 | $3,170 | $122,710 | $45,010 | $77,700 |
| 2020 | $3,170 | $122,710 | $45,010 | $77,700 |
| 2019 | $3,170 | $122,710 | $45,010 | $77,700 |
| 2017 | $3,109 | $116,600 | $42,600 | $74,000 |
| 2016 | $3,109 | $116,600 | $42,600 | $74,000 |
| 2015 | $3,124 | $116,600 | $42,600 | $74,000 |
| 2014 | $3,541 | $135,000 | $48,200 | $86,800 |
Source: Public Records
Map
Nearby Homes
- 15 Suffield St
- 66 Woodcock Ct Unit 66
- 0 N Water St Unit 24138494
- 0 N Water St Unit 24128295
- 0 N Water St Unit 24128294
- 0 N Water St Unit 24128288
- 0 N Water St
- 13 Quail Ct
- 202 Reed Ave
- 4 Pleasant St
- 32 Pleasant Rd
- 30 Barbara Dr
- 19 Dean Ave
- 29 Dean Ave
- 23 Ellis St
- 13 Jubrey Ln
- 143 Bridge St
- 134 Sunset St
- 840 Branch Rd
- 660 East St S
Your Personal Tour Guide
Ask me questions while you tour the home.