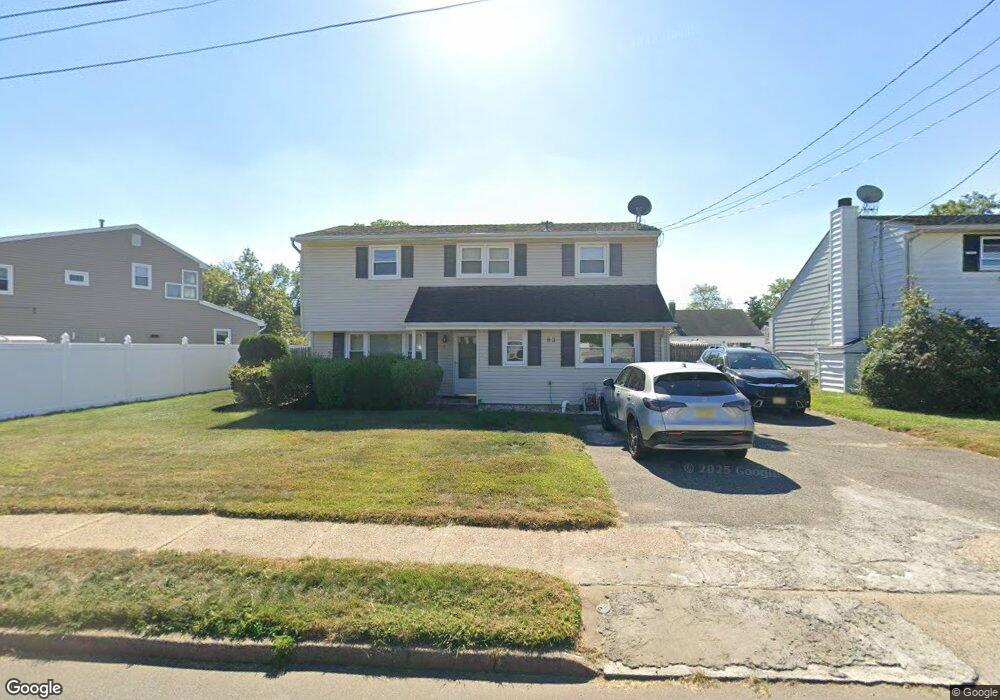
83 Pine St Iselin, NJ 08830
Estimated Value: $350,078 - $575,000
Studio
--
Bath
1,539
Sq Ft
$333/Sq Ft
Est. Value
About This Home
This home is located at 83 Pine St, Iselin, NJ 08830 and is currently estimated at $512,270, approximately $332 per square foot. 83 Pine St is a home located in Middlesex County with nearby schools including Robert Mascenik School #26, Iselin Middle School, and John F. Kennedy Memorial High School.
Ownership History
Date
Name
Owned For
Owner Type
Purchase Details
Closed on
Nov 4, 2013
Sold by
Tin Wan San and Tin Lai Fun
Bought by
Tin Sarah W and Tin Chi K
Current Estimated Value
Purchase Details
Closed on
Jun 20, 2011
Sold by
Tin Wan Sang and Tin Lai Fun
Bought by
Tin Wan Sang and Tin Lai Fun
Create a Home Valuation Report for This Property
The Home Valuation Report is an in-depth analysis detailing your home's value as well as a comparison with similar homes in the area
Home Values in the Area
Average Home Value in this Area
Purchase History
| Date | Buyer | Sale Price | Title Company |
|---|---|---|---|
| Tin Sarah W | -- | None Available | |
| Tin Wan Sang | -- | Professional Abstract & Titl |
Source: Public Records
Tax History
| Year | Tax Paid | Tax Assessment Tax Assessment Total Assessment is a certain percentage of the fair market value that is determined by local assessors to be the total taxable value of land and additions on the property. | Land | Improvement |
|---|---|---|---|---|
| 2025 | $8,721 | $72,400 | $24,000 | $48,400 |
| 2024 | $8,529 | $72,400 | $24,000 | $48,400 |
| 2023 | $8,529 | $72,400 | $24,000 | $48,400 |
| 2022 | $8,317 | $72,400 | $24,000 | $48,400 |
| 2021 | $8,250 | $72,400 | $24,000 | $48,400 |
| 2020 | $7,996 | $72,400 | $24,000 | $48,400 |
| 2019 | $7,806 | $72,400 | $24,000 | $48,400 |
| 2018 | $7,651 | $72,400 | $24,000 | $48,400 |
| 2017 | $7,515 | $72,400 | $24,000 | $48,400 |
| 2016 | $7,462 | $72,400 | $24,000 | $48,400 |
| 2015 | $7,328 | $72,400 | $24,000 | $48,400 |
| 2014 | $7,167 | $72,400 | $24,000 | $48,400 |
Source: Public Records
Map
Nearby Homes
- 19 Claudia St
- 27 Eagle St
- 12 Park Ave
- 29 Park Ave
- 22 Grand Ave
- 1031 Woodruff St
- 147 Warwick St
- 68 Grand Ave
- 281 Middlesex Turnpike
- 145 Creemer Ave
- 99 Elmhurst Ave
- 76 Pleasant Ave
- 109 S Harrison Ave
- 35 Fiat Ave
- 940 Green St
- 40 W Hill Rd
- 373 Fairview Ave
- 90 S Hyde Ave
- 377 New Dover Rd
- 55 Gill Ln Unit 54
Your Personal Tour Guide
Ask me questions while you tour the home.