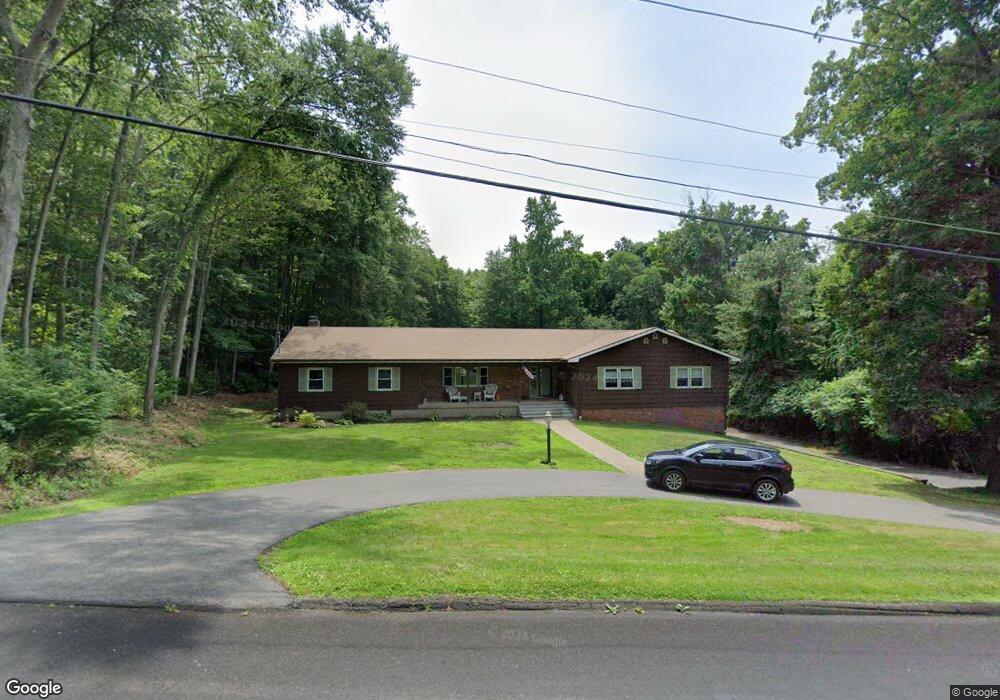
83 Spring St Rockfall, CT 06481
Estimated Value: $473,322 - $668,000
4
Beds
2
Baths
3,032
Sq Ft
$182/Sq Ft
Est. Value
About This Home
This home is located at 83 Spring St, Rockfall, CT 06481 and is currently estimated at $550,831, approximately $181 per square foot. 83 Spring St is a home located in Middlesex County with nearby schools including Frank Ward Strong School, Coginchaug Regional High School, and The Independent Day School.
Ownership History
Date
Name
Owned For
Owner Type
Purchase Details
Closed on
Jan 31, 1996
Sold by
Landry Jean H
Bought by
Scibilia Suzanne M
Current Estimated Value
Create a Home Valuation Report for This Property
The Home Valuation Report is an in-depth analysis detailing your home's value as well as a comparison with similar homes in the area
Home Values in the Area
Average Home Value in this Area
Purchase History
| Date | Buyer | Sale Price | Title Company |
|---|---|---|---|
| Scibilia Suzanne M | $205,000 | -- |
Source: Public Records
Mortgage History
| Date | Status | Borrower | Loan Amount |
|---|---|---|---|
| Open | Scibilia Suzanne M | $150,900 | |
| Closed | Scibilia Suzanne M | $160,000 | |
| Closed | Scibilia Suzanne M | $227,000 | |
| Closed | Scibilia Suzanne M | $155,000 |
Source: Public Records
Tax History
| Year | Tax Paid | Tax Assessment Tax Assessment Total Assessment is a certain percentage of the fair market value that is determined by local assessors to be the total taxable value of land and additions on the property. | Land | Improvement |
|---|---|---|---|---|
| 2025 | $8,162 | $273,900 | $91,000 | $182,900 |
| 2024 | $7,686 | $273,900 | $91,000 | $182,900 |
| 2023 | $7,735 | $273,900 | $91,000 | $182,900 |
| 2022 | $7,549 | $273,900 | $91,000 | $182,900 |
| 2021 | $6,079 | $222,000 | $85,400 | $136,600 |
| 2020 | $7,155 | $222,000 | $85,400 | $136,600 |
| 2019 | $7,208 | $222,000 | $85,400 | $136,600 |
| 2018 | $7,657 | $222,000 | $85,400 | $136,600 |
| 2017 | $8,127 | $222,000 | $85,400 | $136,600 |
| 2016 | $7,504 | $228,500 | $85,400 | $143,100 |
| 2015 | $7,694 | $228,500 | $85,400 | $143,100 |
| 2014 | $7,751 | $228,500 | $85,400 | $143,100 |
Source: Public Records
Map
Nearby Homes
- 1271 Washington St Unit 4
- 5 Lorraine Terrace
- 107 Main St
- 169 Cedar St
- 3 Sisk St
- 57 Edgewood Dr
- 211 Boston Rd
- 160 Boston Rd
- 270 Higby Rd
- 475 Ballfall Rd
- 194 Camp St
- 91 Gleeson Rd
- 45 Mckenna Dr
- 13 Mckenna Dr
- 27 Barbara Rd
- 153 Country Club Rd
- 1 Yellow Wood St
- 473 Westfield St
- 1 Nathan Hale Rd
- 5 Nathan Hale Rd
Your Personal Tour Guide
Ask me questions while you tour the home.