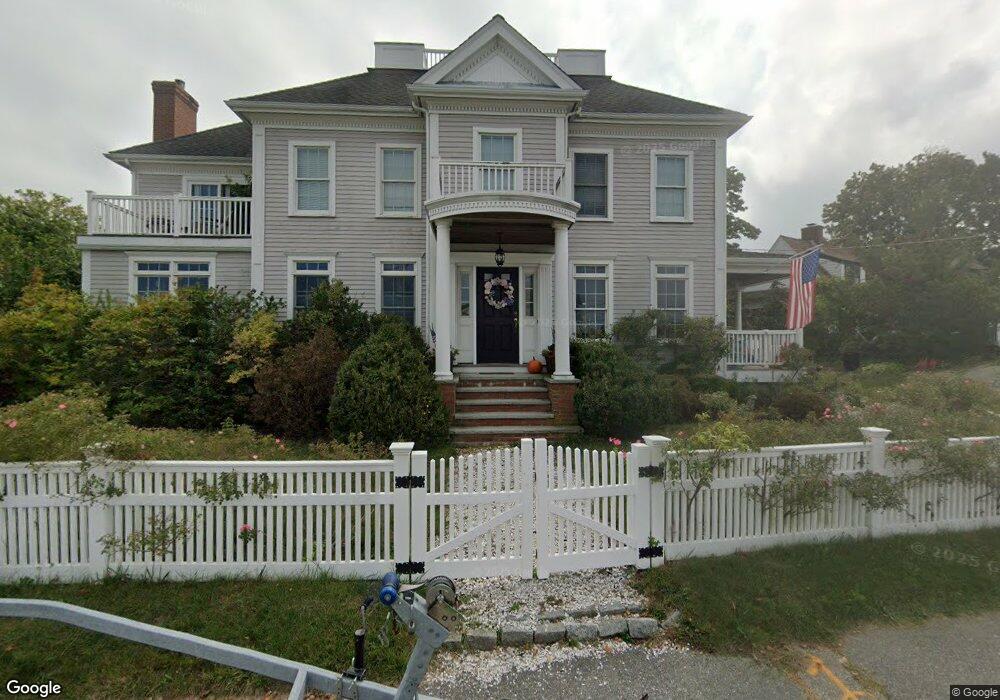
83 Summer St Cohasset, MA 02025
Estimated Value: $2,001,000 - $2,920,000
About This Home
This home is located at 83 Summer St, Cohasset, MA 02025 and is currently estimated at $2,393,398, approximately $571 per square foot. 83 Summer St is a home located in Norfolk County with nearby schools including Joseph Osgood School, Deer Hill School, and Cohasset Middle School.
Ownership History
We collect this data history from publicly available records. To have your information removed, we recommend requesting removal directly through your county’s website.
Purchase Details
Home Financials for this Owner
Home Financials are based on the most recent Mortgage that was taken out on this home.Purchase Details
Home Values in the Area
Average Home Value in this Area
Purchase History
We collect this data history from publicly available records. To have your information removed, we recommend requesting removal directly through your county’s website.
| Date | Buyer | Sale Price | Title Company |
|---|---|---|---|
| $310,000 | -- | ||
| $310,000 | -- | ||
| $275,000 | -- | ||
| $275,000 | -- |
Mortgage History
We collect this data history from publicly available records. To have your information removed, we recommend requesting removal directly through your county’s website.
| Date | Status | Borrower | Loan Amount |
|---|---|---|---|
| Open | $350,000 | ||
| Closed | $100,000 | ||
| Closed | $248,000 |
Tax History
We collect this data history from publicly available records. To have your information removed, we recommend requesting removal directly through your county’s website.
| Year | Tax Paid | Tax Assessment Tax Assessment Total Assessment is a certain percentage of the fair market value that is determined by local assessors to be the total taxable value of land and additions on the property. | Land | Improvement |
|---|---|---|---|---|
| 2025 | $22,835 | $1,971,900 | $1,022,600 | $949,300 |
| 2024 | $22,623 | $1,858,900 | $929,300 | $929,600 |
| 2023 | $19,049 | $1,614,300 | $700,700 | $913,600 |
| 2022 | $19,286 | $1,535,500 | $700,700 | $834,800 |
| 2021 | $16,823 | $1,290,100 | $522,700 | $767,400 |
| 2020 | $16,733 | $1,290,100 | $522,700 | $767,400 |
| 2019 | $16,642 | $1,290,100 | $522,700 | $767,400 |
| 2018 | $16,500 | $1,290,100 | $522,700 | $767,400 |
| 2017 | $16,055 | $1,229,300 | $488,500 | $740,800 |
| 2016 | $14,404 | $1,118,300 | $377,500 | $740,800 |
| 2015 | $13,938 | $1,096,600 | $355,800 | $740,800 |
| 2014 | $13,751 | $1,096,600 | $355,800 | $740,800 |
Map
- 87 Elm St Unit 321
- 87 Elm St Unit 215
- 87 Elm St Unit 323
- 124 Elm St Unit 307
- 124 Elm St Unit 202
- 14 Stockbridge St
- 128 Elm St Unit 313
- 36 Stockbridge St
- 96 Black Horse Ln
- 77 Cushing Rd
- 50 Pond St
- 1 Bailey's Island Rd
- 10 Heritage Ln
- 17 Walnut Hill Ln
- 115 Sohier St
- 392 S Main St
- 169 Pond St
- 45 Hemlock Way
- 67 Border St
- 181 Beechwood St
Ask me questions while you tour the home.