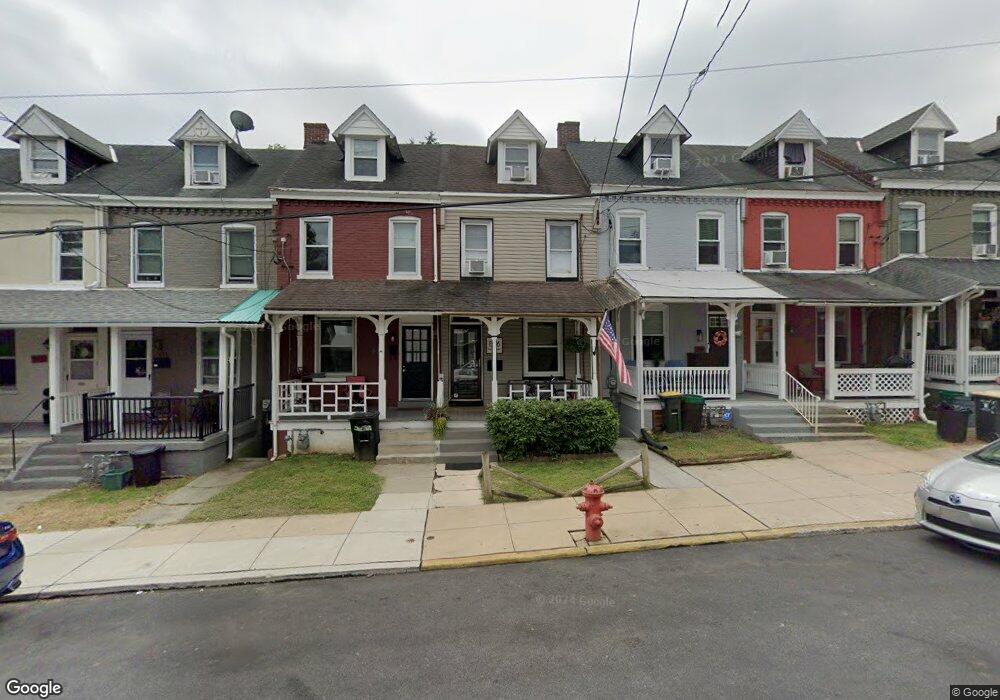
836 4th St Lancaster, PA 17603
West End NeighborhoodEstimated Value: $173,000 - $220,000
2
Beds
1
Bath
1,104
Sq Ft
$177/Sq Ft
Est. Value
About This Home
This home is located at 836 4th St, Lancaster, PA 17603 and is currently estimated at $195,414, approximately $177 per square foot. 836 4th St is a home located in Lancaster County with nearby schools including Smith-Wade-El Elementary School, Wheatland Middle School, and McCaskey High School.
Ownership History
Date
Name
Owned For
Owner Type
Purchase Details
Closed on
Aug 3, 2015
Sold by
Weidlein Carolyn M and Melendez Alpachite
Bought by
Melendez Alpachite
Current Estimated Value
Purchase Details
Closed on
Feb 23, 2007
Sold by
Garber H Louise
Bought by
Weidlein Carolyn M and Melendez Alpachite
Home Financials for this Owner
Home Financials are based on the most recent Mortgage that was taken out on this home.
Original Mortgage
$72,798
Outstanding Balance
$43,869
Interest Rate
6.27%
Mortgage Type
Purchase Money Mortgage
Estimated Equity
$151,545
Create a Home Valuation Report for This Property
The Home Valuation Report is an in-depth analysis detailing your home's value as well as a comparison with similar homes in the area
Home Values in the Area
Average Home Value in this Area
Purchase History
| Date | Buyer | Sale Price | Title Company |
|---|---|---|---|
| Melendez Alpachite | -- | Attorney | |
| Weidlein Carolyn M | $81,900 | None Available |
Source: Public Records
Mortgage History
| Date | Status | Borrower | Loan Amount |
|---|---|---|---|
| Open | Weidlein Carolyn M | $72,798 |
Source: Public Records
Tax History
| Year | Tax Paid | Tax Assessment Tax Assessment Total Assessment is a certain percentage of the fair market value that is determined by local assessors to be the total taxable value of land and additions on the property. | Land | Improvement |
|---|---|---|---|---|
| 2025 | $2,809 | $71,000 | $17,500 | $53,500 |
| 2024 | $2,809 | $71,000 | $17,500 | $53,500 |
| 2023 | $2,762 | $71,000 | $17,500 | $53,500 |
| 2022 | $2,647 | $71,000 | $17,500 | $53,500 |
| 2021 | $2,590 | $71,000 | $17,500 | $53,500 |
| 2020 | $2,590 | $71,000 | $17,500 | $53,500 |
| 2019 | $2,552 | $71,000 | $17,500 | $53,500 |
| 2018 | $1,077 | $71,000 | $17,500 | $53,500 |
| 2017 | $2,738 | $59,600 | $15,700 | $43,900 |
| 2016 | $2,713 | $59,600 | $15,700 | $43,900 |
| 2015 | $1,058 | $59,600 | $15,700 | $43,900 |
| 2014 | $1,940 | $59,600 | $15,700 | $43,900 |
Source: Public Records
Map
Nearby Homes
Your Personal Tour Guide
Ask me questions while you tour the home.