838 3rd St Findlay, OH 45840
Findlay AreaEstimated Value: $192,000 - $224,058
About This Home
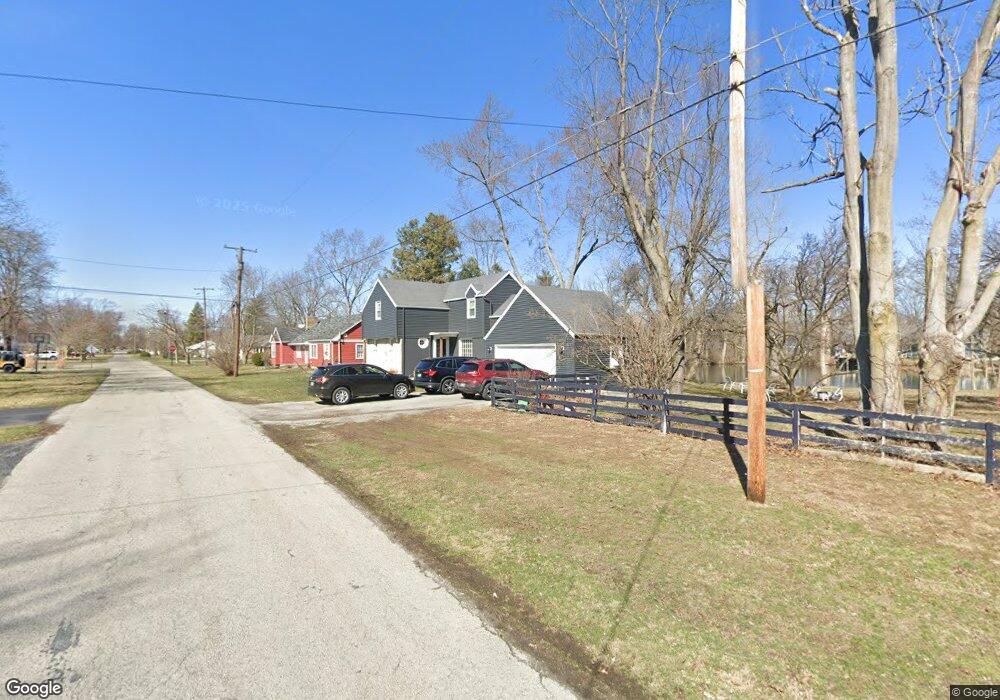
This home is located at 838 3rd St, Findlay, OH 45840 and is currently estimated at $204,765, approximately $137 per square foot. 838 3rd St is a home located in Hancock County with nearby schools including Whittier Elementary School, Wilson Vance Elementary School, and Donnell Middle School.
Ownership History
We collect this data history from publicly available records. To have your information removed, we recommend requesting removal directly through your county’s website.
Purchase Details
Home Financials for this Owner
Home Financials are based on the most recent Mortgage that was taken out on this home.Home Values in the Area
Average Home Value in this Area
Purchase History
We collect this data history from publicly available records. To have your information removed, we recommend requesting removal directly through your county’s website.
| Date | Buyer | Sale Price | Title Company |
|---|---|---|---|
| $120,000 | Wolph Title Inc |
Mortgage History
We collect this data history from publicly available records. To have your information removed, we recommend requesting removal directly through your county’s website.
| Date | Status | Borrower | Loan Amount |
|---|---|---|---|
| Open | $3,581 | ||
| Closed | $3,238 | ||
| Closed | $2,456 | ||
| Open | $117,826 | ||
| Closed | $117,826 |
Tax History
We collect this data history from publicly available records. To have your information removed, we recommend requesting removal directly through your county’s website.
| Year | Tax Paid | Tax Assessment Tax Assessment Total Assessment is a certain percentage of the fair market value that is determined by local assessors to be the total taxable value of land and additions on the property. | Land | Improvement |
|---|---|---|---|---|
| 2025 | $1,915 | $62,460 | $15,100 | $47,360 |
| 2024 | $1,803 | $50,770 | $12,270 | $38,500 |
| 2023 | $1,806 | $50,770 | $12,270 | $38,500 |
| 2022 | $1,800 | $50,770 | $12,270 | $38,500 |
| 2021 | $1,685 | $41,390 | $14,430 | $26,960 |
| 2020 | $1,684 | $41,390 | $14,430 | $26,960 |
| 2019 | $1,650 | $41,390 | $14,430 | $26,960 |
| 2018 | $1,778 | $40,860 | $14,430 | $26,430 |
| 2017 | $912 | $40,860 | $14,430 | $26,430 |
| 2016 | $1,804 | $40,860 | $14,430 | $26,430 |
| 2015 | $1,419 | $31,540 | $7,220 | $24,320 |
| 2014 | $1,419 | $31,540 | $7,220 | $24,320 |
| 2012 | $1,409 | $31,050 | $7,220 | $23,830 |
Map
- 1229 Leiser Ave
- 1125 S Blanchard St
- 943 Breezewood Ct
- 1119 Washington Ave
- 923 Washington Ave
- 325 Greenlawn Ave
- 15586 Canadian Way
- 1220 6th St
- 1105 1st St
- 0 Blanchard Ave
- 127 1st St
- 119 Greenlawn Ave
- 853 Beech Ave
- 1041 S Main St
- 1809 Park St
- 1720 Washington Ave
- 1200 S Main St
- 814 Beech Ave
- 835 S Main St
- 314 & 316 E Hardin St
Ask me questions while you tour the home.