838 S Main St Bellingham, MA 02019
Estimated Value: $443,000 - $622,000
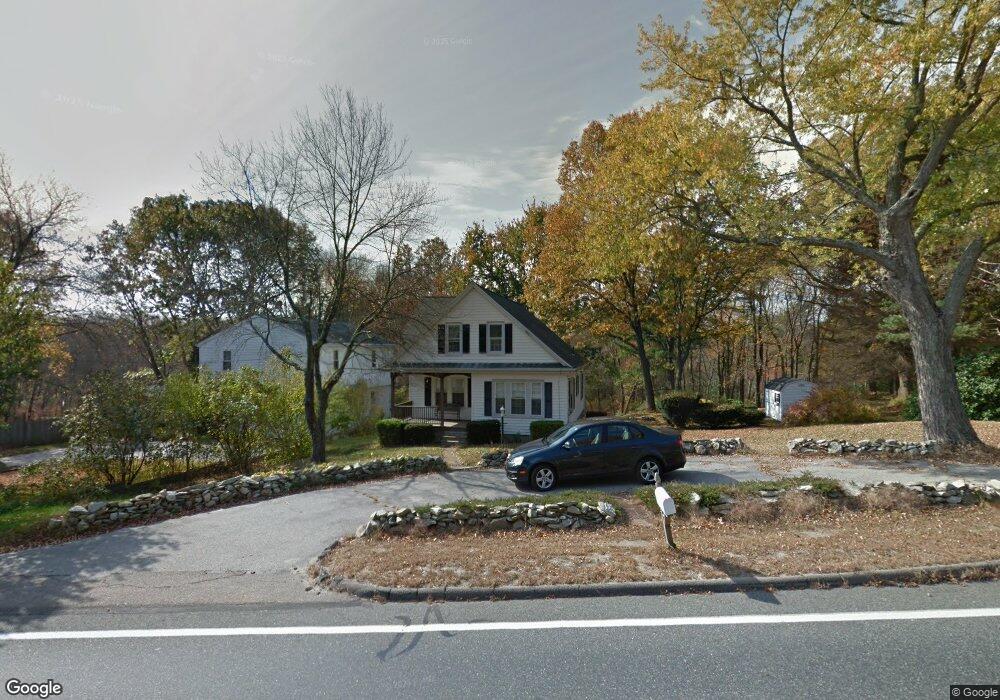
About This Home
This home is located at 838 S Main St, Bellingham, MA 02019 and is currently estimated at $520,626, approximately $369 per square foot. 838 S Main St is a home located in Norfolk County with nearby schools including Joseph F. DiPietro Elementary, Bellingham High School, and Rise Prep Mayoral Academy Middle School.
Ownership History
We collect this data history from publicly available records. To have your information removed, we recommend requesting removal directly through your county’s website.
Purchase Details
Home Values in the Area
Average Home Value in this Area
Purchase History
We collect this data history from publicly available records. To have your information removed, we recommend requesting removal directly through your county’s website.
| Date | Buyer | Sale Price | Title Company |
|---|---|---|---|
| $116,500 | -- |
Mortgage History
We collect this data history from publicly available records. To have your information removed, we recommend requesting removal directly through your county’s website.
| Date | Status | Borrower | Loan Amount |
|---|---|---|---|
| Previous Owner | $30,000 |
Tax History
We collect this data history from publicly available records. To have your information removed, we recommend requesting removal directly through your county’s website.
| Year | Tax Paid | Tax Assessment Tax Assessment Total Assessment is a certain percentage of the fair market value that is determined by local assessors to be the total taxable value of land and additions on the property. | Land | Improvement |
|---|---|---|---|---|
| 2025 | $4,582 | $364,800 | $158,800 | $206,000 |
| 2024 | $4,392 | $341,500 | $145,000 | $196,500 |
| 2023 | $4,232 | $324,300 | $138,000 | $186,300 |
| 2022 | $4,166 | $295,900 | $118,400 | $177,500 |
| 2021 | $4,043 | $280,600 | $118,400 | $162,200 |
| 2020 | $3,882 | $273,000 | $118,400 | $154,600 |
| 2019 | $3,801 | $267,500 | $118,400 | $149,100 |
| 2018 | $3,631 | $252,000 | $119,300 | $132,700 |
| 2017 | $3,551 | $247,600 | $119,300 | $128,300 |
| 2016 | $3,435 | $240,400 | $124,100 | $116,300 |
| 2015 | $3,295 | $231,200 | $119,300 | $111,900 |
| 2014 | $3,291 | $224,500 | $115,800 | $108,700 |
Map
- 61 Scott Hill Blvd
- 0 North St Unit 73440626
- 11 Quail Run Rd
- 35 Chestnut St
- 11 Lilac Ave
- 98 Indian Run Rd
- 9 Laurel Ln
- 62 North St
- 4 Candlelight Ln
- 1 Whitman Cir Unit 1
- 3 Whitman Cir Unit 3
- 7 Whitman Cir Unit 7
- 23 Bellstone Dr
- 218 Blackstone St
- 360 S Main St
- 30 Pine Warbler Way
- 238 Lake St
- 89 Elm St
- 98 Elm St
- 1250 Pulaski Blvd
- 2 Scott Hill Blvd
- 846 S Main St
- 847 S Main St
- 836 S Main St
- 5 Scott Hill Blvd
- 843 S Main St Unit 1
- 841 S Main St
- 843 S Main St
- 843 S Main St Unit 843
- 835 S Main St
- 211 S Main St
- 7 Scott Hill Blvd
- 832 S Main St
- 853 S Main St
- 853 S Main St Unit 2
- 828 S Main St
- 826 S Main St
- 828 S Main St Unit B 828
- 826 S Main St Unit 826
- 829 S Main St Unit 2
Ask me questions while you tour the home.