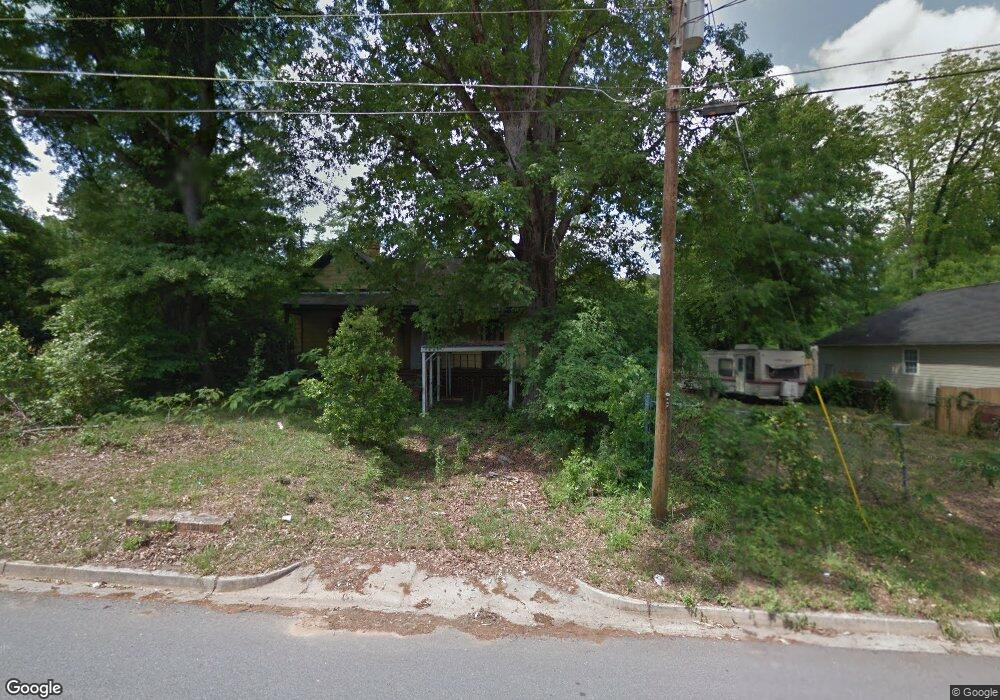
838 Womack St Macon, GA 31217
Fort Hill Historic District NeighborhoodEstimated Value: $40,000 - $93,000
2
Beds
1
Bath
1,251
Sq Ft
$52/Sq Ft
Est. Value
About This Home
This home is located at 838 Womack St, Macon, GA 31217 and is currently estimated at $65,155, approximately $52 per square foot. 838 Womack St is a home located in Bibb County with nearby schools including Burdell Elementary School, Appling Middle School, and Northeast High School.
Ownership History
Date
Name
Owned For
Owner Type
Purchase Details
Closed on
Jul 3, 2023
Sold by
Scotts Family Investments Llc
Bought by
Investing 1033 Llc
Current Estimated Value
Purchase Details
Closed on
Oct 28, 2021
Sold by
Macon Bibb County Land Bank Authority
Bought by
Scotts Family Investment Llc
Purchase Details
Closed on
Oct 12, 2021
Sold by
Solomon Mary Lizzie and Thorpe Tony J
Bought by
Macon-Bibb County Land Bank Authority
Purchase Details
Closed on
Aug 6, 1992
Sold by
Deeb Mark
Bought by
Solomon Mary Lizzie
Create a Home Valuation Report for This Property
The Home Valuation Report is an in-depth analysis detailing your home's value as well as a comparison with similar homes in the area
Home Values in the Area
Average Home Value in this Area
Purchase History
We collect this data history from publicly available records. To have your information removed, we recommend requesting removal directly through your county’s website.
| Date | Buyer | Sale Price | Title Company |
|---|---|---|---|
| Investing 1033 Llc | -- | None Listed On Document | |
| Scotts Family Investment Llc | $5,500 | None Available | |
| Macon-Bibb County Land Bank Authority | $3,916 | None Listed On Document | |
| Solomon Mary Lizzie | $1,500 | -- |
Source: Public Records
Tax History
| Year | Tax Paid | Tax Assessment Tax Assessment Total Assessment is a certain percentage of the fair market value that is determined by local assessors to be the total taxable value of land and additions on the property. | Land | Improvement |
|---|---|---|---|---|
| 2025 | $149 | $6,082 | $1,980 | $4,102 |
| 2024 | $121 | $4,772 | $1,080 | $3,692 |
| 2023 | $117 | $4,592 | $900 | $3,692 |
| 2022 | $372 | $2,618 | $1,388 | $1,230 |
| 2021 | $223 | $1,414 | $520 | $894 |
| 2020 | $213 | $1,324 | $520 | $804 |
| 2019 | $48 | $1,235 | $520 | $715 |
| 2018 | $254 | $1,235 | $520 | $715 |
| 2017 | $76 | $2,037 | $520 | $1,517 |
| 2016 | $70 | $2,038 | $520 | $1,517 |
| 2015 | $100 | $2,038 | $520 | $1,517 |
| 2014 | $138 | $2,452 | $555 | $1,897 |
Source: Public Records
Map
Nearby Homes
- 856 Center St
- 645 Cowan St
- 826 Fort Hill St
- 873 Fort Hill St
- 666 Woolfolk St
- 734 Fort Hill St
- 692 Center St
- 722 Mitchell St
- 760 Cowan St
- 1155 Mitchell St
- 1059 Fort Hill St
- 544 Hall St
- 774 Maynard St
- 768 Maynard St
- 624 & 636 Church St
- 735 Maynard St
- 347 Woolfolk St
- 725 Schaeffer Place
- 1006 Clay Ave Unit 1008,1020,1022
- 508 Willingham Ct
Your Personal Tour Guide
Ask me questions while you tour the home.