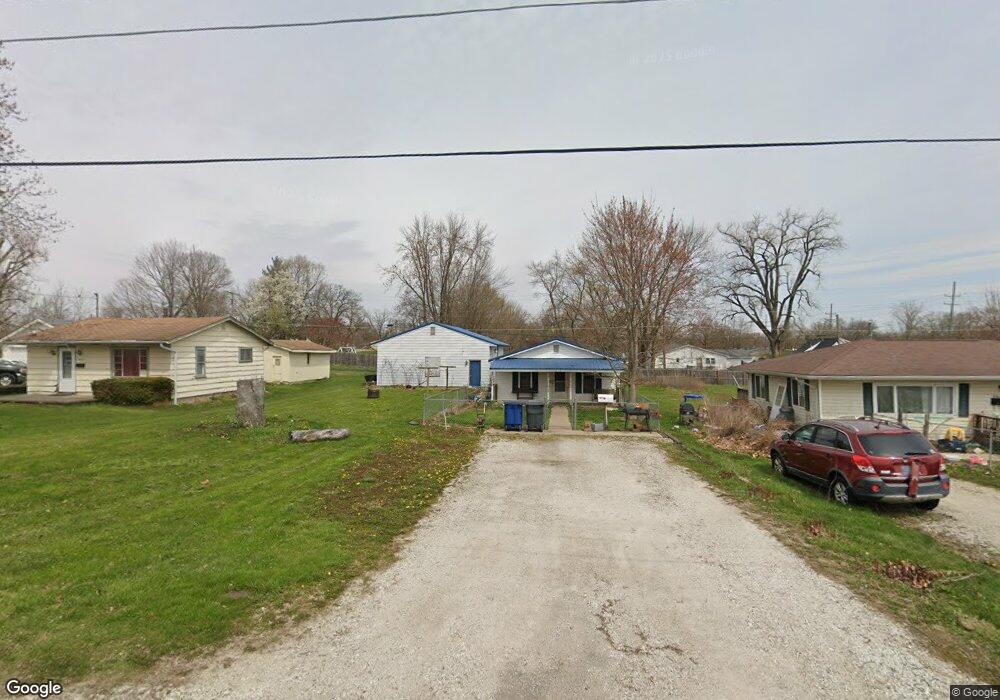
839 E Walnut St Marion, IN 46952
Northeast Marion NeighborhoodEstimated Value: $95,000 - $117,626
3
Beds
1
Bath
1,344
Sq Ft
$81/Sq Ft
Est. Value
About This Home
This home is located at 839 E Walnut St, Marion, IN 46952 and is currently estimated at $108,407, approximately $80 per square foot. 839 E Walnut St is a home located in Grant County with nearby schools including Allen Elementary School, Justice Thurgood Marshall Intermediate School, and John L. McCulloch Junior High School.
Ownership History
Date
Name
Owned For
Owner Type
Purchase Details
Closed on
Oct 15, 2021
Sold by
Tinkel Timothy K and Tinkel Teresa L
Bought by
Burkhart Matthew
Current Estimated Value
Home Financials for this Owner
Home Financials are based on the most recent Mortgage that was taken out on this home.
Original Mortgage
$77,000
Outstanding Balance
$69,451
Interest Rate
2.8%
Mortgage Type
New Conventional
Estimated Equity
$38,957
Purchase Details
Closed on
Oct 25, 2010
Sold by
City Of Marion
Bought by
Tinkel Timoth K and Tinkel Teresa L
Create a Home Valuation Report for This Property
The Home Valuation Report is an in-depth analysis detailing your home's value as well as a comparison with similar homes in the area
Home Values in the Area
Average Home Value in this Area
Purchase History
| Date | Buyer | Sale Price | Title Company |
|---|---|---|---|
| Burkhart Matthew | -- | None Listed On Document | |
| Tinkel Timoth K | -- | None Available |
Source: Public Records
Mortgage History
| Date | Status | Borrower | Loan Amount |
|---|---|---|---|
| Open | Burkhart Matthew | $77,000 |
Source: Public Records
Tax History
| Year | Tax Paid | Tax Assessment Tax Assessment Total Assessment is a certain percentage of the fair market value that is determined by local assessors to be the total taxable value of land and additions on the property. | Land | Improvement |
|---|---|---|---|---|
| 2025 | $785 | $104,800 | $8,900 | $95,900 |
| 2024 | $785 | $87,000 | $8,900 | $78,100 |
| 2023 | $668 | $82,300 | $8,900 | $73,400 |
| 2022 | $598 | $76,300 | $8,500 | $67,800 |
| 2021 | $371 | $51,700 | $4,300 | $47,400 |
| 2020 | $390 | $47,200 | $4,300 | $42,900 |
| 2019 | $368 | $47,300 | $4,300 | $43,000 |
| 2018 | $334 | $47,300 | $4,300 | $43,000 |
| 2017 | $317 | $46,600 | $4,300 | $42,300 |
| 2016 | $287 | $45,500 | $4,300 | $41,200 |
| 2014 | $300 | $47,900 | $4,300 | $43,600 |
| 2013 | $300 | $48,400 | $4,300 | $44,100 |
Source: Public Records
Map
Nearby Homes
- 1113 E Grant St
- 558 E Swayzee St
- 510 E Grant St
- 410 N Vickery Ln
- 1009 E Montpelier Pike
- 425 E Bradford St
- 416 E Bradford St
- 1403 E Elm Ln
- 618 N Branson St
- 1700 E Bradford Pike
- 622 N Washington St
- 624 N Washington St
- 822 S Branson St
- 229 W Spencer Ave
- 101 S Nebraska St
- 935 S Branson St
- 528 E Wiley St
- 417 W Nelson St
- 420 W 1st St
- 215 W 7th St
- 841 E Walnut St
- 823 E Walnut St
- 819 E Walnut St
- 832 E Grant St
- 843 E Walnut St
- 836 E Grant St
- 815 E Walnut St
- 840 E Walnut St
- 842 E Walnut St
- 844 E Grant St
- 818 E Grant St
- 844 E Walnut St
- 818 E Walnut St
- 811 E Walnut St
- 900 E Grant St
- 803 E Walnut St
- 821 E Grant St
- 816 E Grant St
- 902 E Grant St
- 817 E Grant St
Your Personal Tour Guide
Ask me questions while you tour the home.