84 Spring St Cambridge, MA 02141
East Cambridge NeighborhoodEstimated Value: $917,000 - $1,443,000
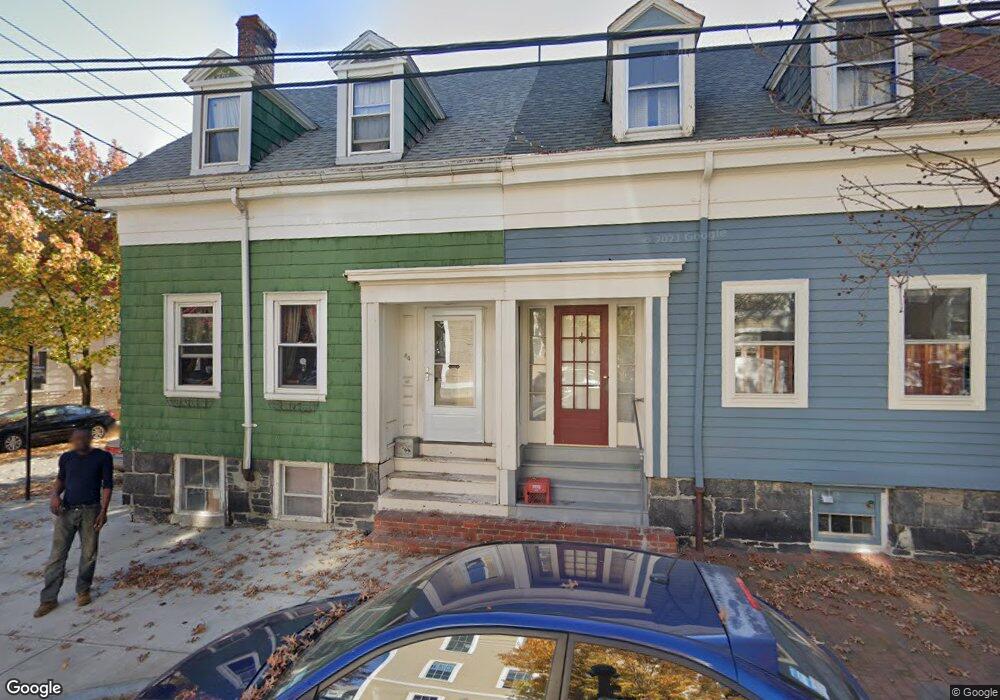
About This Home
This home is located at 84 Spring St, Cambridge, MA 02141 and is currently estimated at $1,191,546, approximately $1,149 per square foot. 84 Spring St is a home located in Middlesex County with nearby schools including Prospect Hill Academy Charter School and Community Charter School of Cambridge.
Ownership History
We collect this data history from publicly available records. To have your information removed, we recommend requesting removal directly through your county’s website.
Purchase Details
Home Values in the Area
Average Home Value in this Area
Purchase History
We collect this data history from publicly available records. To have your information removed, we recommend requesting removal directly through your county’s website.
| Date | Buyer | Sale Price | Title Company |
|---|---|---|---|
| $163,000 | -- |
Mortgage History
We collect this data history from publicly available records. To have your information removed, we recommend requesting removal directly through your county’s website.
| Date | Status | Borrower | Loan Amount |
|---|---|---|---|
| Open | $36,000 | ||
| Closed | $29,100 | ||
| Open | $152,000 |
Tax History
We collect this data history from publicly available records. To have your information removed, we recommend requesting removal directly through your county’s website.
| Year | Tax Paid | Tax Assessment Tax Assessment Total Assessment is a certain percentage of the fair market value that is determined by local assessors to be the total taxable value of land and additions on the property. | Land | Improvement |
|---|---|---|---|---|
| 2025 | $6,128 | $965,000 | $571,000 | $394,000 |
| 2024 | $5,682 | $959,800 | $620,100 | $339,700 |
| 2023 | $5,430 | $926,600 | $592,000 | $334,600 |
| 2022 | $5,327 | $899,800 | $605,700 | $294,100 |
| 2021 | $9,620 | $868,700 | $594,400 | $274,300 |
| 2020 | $1,125 | $868,800 | $600,000 | $268,800 |
| 2019 | $8,311 | $838,100 | $588,500 | $249,600 |
| 2018 | $3,499 | $719,200 | $488,000 | $231,200 |
| 2017 | $4,263 | $656,900 | $436,400 | $220,500 |
| 2016 | $3,873 | $554,100 | $341,600 | $212,500 |
| 2015 | $3,786 | $484,200 | $292,800 | $191,400 |
| 2014 | $3,485 | $415,900 | $226,800 | $189,100 |
Map
- 241 Hurley St Unit 1
- 110 Spring St
- 131 Charles St
- 104 Thorndike St Unit 1
- 104 Thorndike St Unit 2
- 122 Charles St Unit 124-1
- 213 Third St
- 93 Third St
- 138 Thorndike St
- 57 Hurley St Unit 3
- 95 2nd St Unit 3
- 32 5th St Unit 1
- 30 2nd St Unit B
- 30 2nd St Unit A
- 30
- 3 Mullins Ct Unit 3
- 17 Otis St Unit 105
- 71 Fulkerson St Unit 210
- 71 Fulkerson St Unit 309
- 51 Fulkerson St
- 103 Sciarappa St
- 103 Sciarappa St Unit 3
- 103 Sciarappa St Unit 2
- 103 Sciarappa St
- 103 Sciarappa St Unit 1
- 4 4th Street Place
- 6 4th Street Place
- 6 4th Street Place Unit 3
- 6 4th Street Place Unit 2
- 6 4th Street Place Unit 1
- 6 4th Street Place Unit 6
- 105 Sciarappa St Unit 2F
- 105 Sciarappa St Unit 3R
- 105 Sciarappa St Unit 1R
- 105 Sciarappa St Unit 2R
- 105 Sciarappa St Unit 3F
- 249 Hurley St
- 249 Hurley St Unit 1R2
- 249 Hurley St
- 249 Hurley St Unit 1T
Ask me questions while you tour the home.